
Aroon Indicator Strategy on Bitcoin: Full Backtest Results
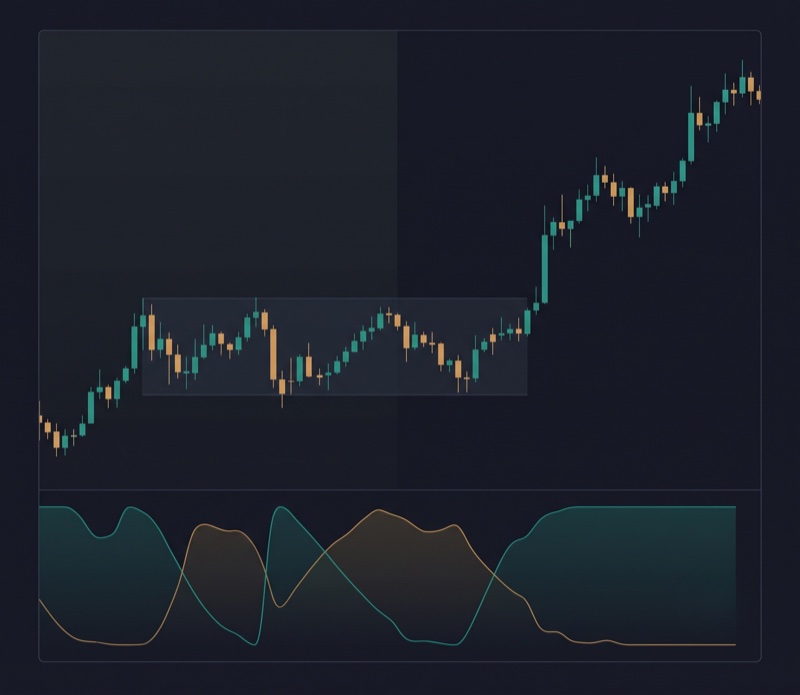
The Aroon indicator has a reputation for spotting new trends before other tools pick them up. Unlike a moving average that lags price, Aroon measures time: how many bars have passed since the last high and the last low.
That timing angle is what makes traders interested in it. The theory is that a strong new uptrend will keep making fresh highs, which keeps the Aroon Up reading elevated. When the Aroon Up is high and the Aroon Down is low at the same time, the argument goes, you are early into a trend that has room to run.
This article tests that argument against four and a half years of Bitcoin data. No smoothing, no parameter optimization. One set of rules, run from start to finish.
What the Aroon Indicator Measures
The Aroon indicator was developed by Tushar Chande in 1995. It uses two lines:
Aroon Up: percentage of time elapsed since the last highest high within the period
Aroon Down: percentage of time elapsed since the last lowest low within the period
Both lines move between 0 and 100. An Aroon Up reading above 70 means the market recently made a fresh high relative to the lookback window. An Aroon Down reading below 30 means the most recent low is far back in time, which suggests the downside pressure has faded.
The combination of Aroon Up above 70 and Aroon Down below 30 is the classic "trend is starting and gaining strength" signal.
Strategy Rules
The backtest uses a standard Aroon setup with a 25-period lookback. The rules are mechanical with no discretion:
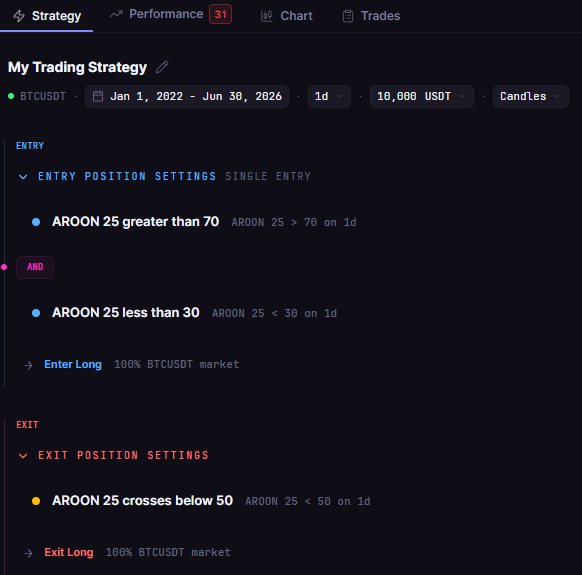
Entry: Aroon Up (25) is above 70 AND Aroon Down (25) is below 30
Exit: Aroon Up (25) crosses below 50
Direction: Long only, no leverage
Position size: 100% of equity per trade
The exit at Aroon Up crossing below 50 is designed to keep the position open while momentum is strong and close it when the trend signal weakens, before a full reversal.
Test Setup
The backtest ran on CoinQuant using daily Bitcoin data from Kaiko.
| Parameter | Setting |
|---|---|
| Instrument | BTCUSDT (spot) |
| Timeframe | Daily (1D) |
| Period | Jan 2022 to Jun 2026 |
| Aroon period | 25 |
| Entry signal | Aroon Up > 70 AND Aroon Down < 30 |
| Exit signal | Aroon Up crosses below 50 |
| Direction | Long only, no leverage |
| Initial capital | $10,000 |
| Position size | 100% of equity |
| Fees | Binance standard (0.1% taker) |
| Slippage | 0% |
The Backtest Results
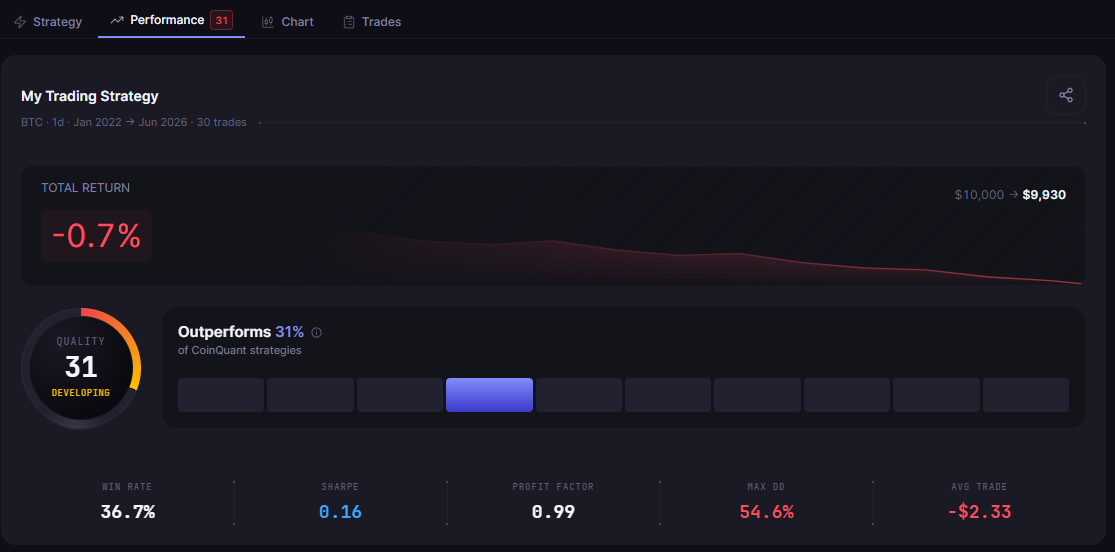
Over the 2022 to 2026 period, the Aroon strategy produced a -0.70% total return on a $10,000 starting balance. The strategy fired 30 trades but only converted 11 of them into winners, for a win rate of 36.7%.
| Metric | Result |
|---|---|
| Total Return | -0.70% |
| Total Trades | 30 |
| Win Rate | 36.7% (11W / 19L) |
| Max Drawdown | 54.64% |
| Sharpe Ratio | 0.16 |
| Profit Factor | 0.99 |
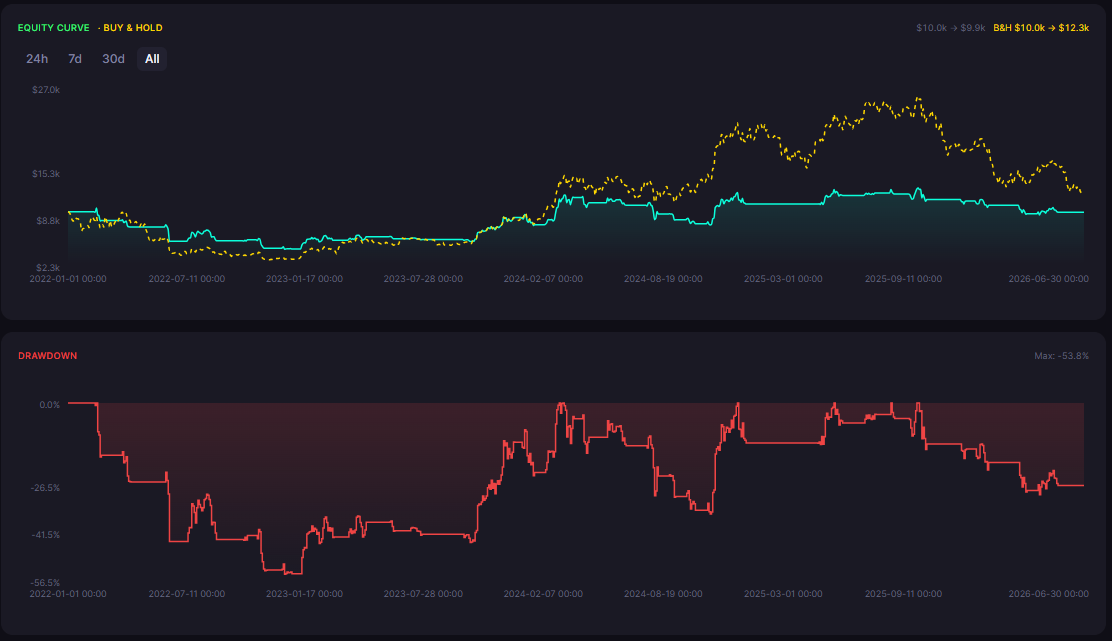
The max drawdown of 54.64% means that at its worst point, the strategy's running balance was more than half underwater from its peak. For a strategy that produced essentially no return, that is a painful risk profile: high pain, no gain.
What the Data Shows
The headline number says "flat," but the trade log tells a more specific story.
The 2022 to 2026 window was one of the most difficult periods for trend-following on Bitcoin. The market spent the first half of 2022 in a sustained bear market, then recovered through 2023, then entered an extended consolidation through mid-2025 before staging another run.
The Aroon strategy struggled on two fronts:
Too many false entries. With 30 trades across four and a half years, the strategy entered an average of roughly six times per year. Many of these entries caught short-lived bounces, not real trend starts. Each false entry that reversed ate into capital.
Asymmetric losses. A 36.7% win rate requires wins to be significantly larger than losses to break even. In this test, the wins were not large enough to compensate. The result is a negative expectancy: on average, each trade cost more than it returned.
Why Aroon Struggles as a Standalone Strategy
The Aroon indicator was designed to detect trend changes, not to serve as a complete trading system on its own.
When a new uptrend on Bitcoin genuinely takes hold, the Aroon Up signal is useful. The problem is that in a market that chops between ranges, the Aroon Up frequently spikes above 70 on minor rallies that never develop into trends. Without a higher-timeframe filter to confirm the broader trend is intact, a standalone Aroon system will take most of those false signals.
This is not a flaw in the indicator. It is a flaw in how the indicator is used.
Three adjustments are worth testing before discarding Aroon entirely:
Add a trend filter. Require price to be above the 200-day SMA before entries. This removes signals during downtrends where the Aroon Up spike is just a relief rally.
Tighten the exit. Instead of waiting for Aroon Up to cross below 50, use a trailing stop based on ATR. This could reduce the severity of drawdowns on losing trades.
Increase the lookback period. A 25-period Aroon on a daily chart responds to moves within the past 25 days. A 50 or 75-period setting would smooth out shorter-term signals and focus on longer trend structures.
Each of these requires its own backtest before it earns a place in a live strategy.
Aroon vs. Bitcoin Buy-and-Hold
Over the same 2022 to 2026 period, buy-and-hold Bitcoin significantly outperformed the Aroon strategy on total return, though it came with its own steep drawdowns.
| Approach | Total Return | Key Risk |
|---|---|---|
| Aroon strategy | -0.70% | 54.64% max drawdown |
| Buy and hold Bitcoin | Much higher | Full cycle drawdowns |
The Aroon strategy failed to beat its benchmark by a wide margin and took on nearly as much drawdown. This is the weakest possible outcome for an active strategy: more complexity, no additional return, similar risk.
The Practical Lesson
This backtest is not a verdict against the Aroon indicator. It is a verdict against using any single indicator as a complete trading system without testing it first.
The Aroon indicator identifies something real: the recency of new highs and new lows relative to recent price history. That information can be valuable as part of a multi-condition strategy or as a confirmation filter. Used alone on a volatile asset like Bitcoin across a bear-market and range-bound period, it generated too many false signals to produce positive returns.
The right response is not to discard Aroon but to understand what it measures and where it adds value.
Run this Aroon backtest yourself and test variations with your own filters and parameters on CoinQuant. Backtest the Aroon strategy free on CoinQuant
Disclaimer:
Key Takeaway
