
Stochastic Oscillator Strategy Backtest on Bitcoin: What 12 Months of Data Actually Shows
The Stochastic oscillator is one of the most widely used momentum indicators in trading, and its most popular application is dead simple: buy when %K crosses above %D, sell when %K crosses below %D. The indicator tracks where the closing price sits within the recent high-low range, and the crossover is supposed to catch the moment momentum rotates.
Simple is not the same as profitable. This article runs the pure %K/%D crossover strategy on daily Bitcoin over 12 months, September 2025 to September 2026, in three settings: the classic 14,3,3 defaults, a faster 5,3,3 variant, and a slower 21,5,5 variant. Same asset, same window, same fees, one variable changed. The results answer the question directly: does the default setting outperform shorter or longer periods, and does any of them produce an edge after costs?
The Three Strategies
BTC Stochastic 14-3-3 Cross 1D
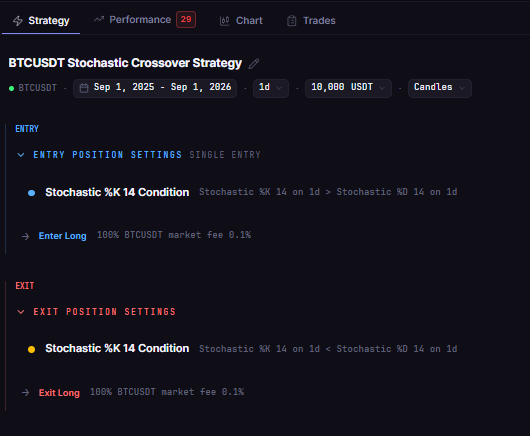
The classic configuration. Entry fires when %K(14) with 3-period %K smoothing and 3-period %D smoothing crosses above %D. Exit fires when %K crosses back below %D. This is the textbook Stochastic crossover as most tutorials describe it.
BTC Stochastic 5-3-3 Cross 1D
The fast variant. %K uses a 5-period lookback with the %D line at 3 periods, so signals react to shorter swings. Faster settings generate more signals and are more sensitive to noise.
BTC Stochastic 21-5-5 Cross 1D
The slow variant. %K uses a 21-period lookback with 5-period smoothing on both lines, so signals only fire on slower, larger rotations. Slower settings generate fewer signals and are supposed to filter noise.
All three are long only, one position at a time, 100% of equity per entry, 0.1% taker fee modeled, on BTCUSDT daily.
Test Setup
| Parameter | Default 14,3,3 | Fast 5,3,3 | Slow 21,5,5 |
|---|---|---|---|
| Strategy | BTC Stochastic 14-3-3 Cross 1D | BTC Stochastic 5-3-3 Cross 1D | BTC Stochastic 21-5-5 Cross 1D |
| Instrument | BTCUSDT (spot, Binance) | BTCUSDT (spot, Binance) | BTCUSDT (spot, Binance) |
| Timeframe | Daily (1D) | Daily (1D) | Daily (1D) |
| Tested window | 2025-09-01 to 2026-09-01 | 2025-09-01 to 2026-09-01 | 2025-09-01 to 2026-09-01 |
| Entry | %K crosses above %D | %K crosses above %D | %K crosses above %D |
| Exit | %K crosses below %D | %K crosses below %D | %K crosses below %D |
| Direction | Long only, no leverage | Long only, no leverage | Long only, no leverage |
| Initial capital | $10,000 | $10,000 | $10,000 |
| Position size | 100% of equity per entry | 100% of equity per entry | 100% of equity per entry |
| Fees | 0.1% taker, modeled | 0.1% taker, modeled | 0.1% taker, modeled |
| Data source | Kaiko via CoinQuant | Kaiko via CoinQuant | Kaiko via CoinQuant |
The Backtest Results
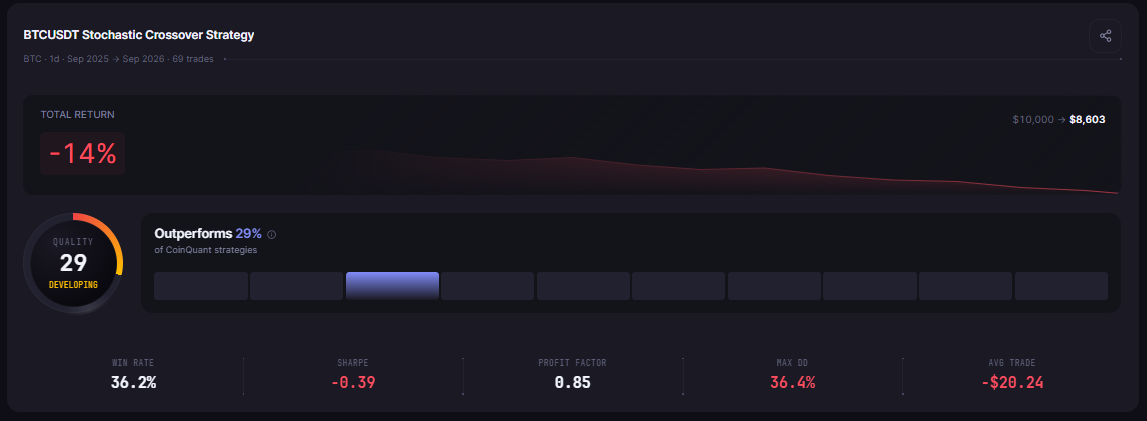
The 12 months of data are unambiguous: all three settings lost money after fees, and the default 14,3,3 lost the least.
| Metric | Stochastic 14,3,3 | Stochastic 5,3,3 | Stochastic 21,5,5 |
|---|---|---|---|
| Total Return | -13.97% | -25.08% | -22.62% |
| Final Balance | $8,603.11 | $7,491.91 | $7,738.25 |
| Total Trades | 69 | 72 | 55 |
| Win Rate | 36.2% (25W / 44L) | 36.1% (26W / 46L) | 25.5% (14W / 41L) |
| Profit Factor | 0.85 | 0.74 | 0.73 |
| Sharpe Ratio | -0.39 | -0.94 | -0.78 |
| Sortino Ratio | -0.57 | -1.31 | -1.13 |
| Max Drawdown | 36.39% | 39.04% | 39.36% |
| Average Win | $326.64 | $277.01 | $434.41 |
| Average Loss | $217.34 | $211.09 | $203.50 |
| Best Trade | +$1,564.45 | +$1,099.04 | +$1,319.17 |
| Worst Trade | -$663.32 | -$714.68 | -$698.76 |
| Time in Market | 52.46% | 50.82% | 52.46% |
| Total Fees | $1,227.30 | $1,241.08 | $986.39 |
What the Data Shows
The default setting beat both variants, and the gap is meaningful: the 14,3,3 lost 13.97% while the fast 5,3,3 lost 25.08% and the slow 21,5,5 lost 22.62%. The fast variant traded most (72 trades), paid the most in fees ($1,241.08), and lost the most. Speed did not create edge, it created turnover.
The more striking number is the win rate structure. The 14,3,3 and 5,3,3 both won roughly 36% of trades, but the default still outperformed the fast version because of the payoff: its average win of $326.64 was about 50% larger than its average loss of $217.34, a payoff ratio near 1.5, while the fast version's $277.01 average win was only about 31% larger than its $211.09 average loss, a payoff ratio that needs a win rate above 43% to break even.
Why the Pure Crossover Fails on Daily Bitcoin
The pure %K/%D crossover has a structural weakness that this window exposes: it fires at every rotation of the oscillator, with no condition on where in the range the cross happens. A crossover near the middle of the range, at Stochastic values around 50, is not a momentum signal, it is noise, and the backtest shows the consequence in the trade distribution.
None of the three settings spent less than half the year in the market (time in market between 50.82% and 52.46%), which is the signature of a strategy that is almost always positioned and almost always wrong about the direction of the next move. A momentum rotation signal without a regime filter buys every whipsaw.
The fee drag is the second story. The default paid $1,227.30 in fees on a $10,000 account, 12.3% of capital, and the fast variant paid $1,241.08. Before fees, the default's gross result was close to break-even, which means the crossover idea itself was roughly neutral on daily Bitcoin in this window, and costs pushed a neutral idea into a losing one.
The Practical Lesson
The default 14,3,3 setting outperformed both variants, which confirms the textbook choice, and still lost 13.97% after fees in this 12-month window
Faster settings did not create edge, they created turnover: 72 trades, $1,241.08 in fees, and the worst return
A pure %K/%D crossover with no oversold zone filter and no regime filter whipsaws on daily Bitcoin, spending half the year in the market with a sub-40% win rate
Fees decided the outcome: the default strategy was near break-even gross, and modeled costs pushed it negative
The Stochastic crossover question is answered for this window: on daily Bitcoin from September 2025 to September 2026, none of the three settings produced an edge after fees, and the classic 14,3,3 was the least bad. The natural next tests are the variations this article did not run: a crossover that only fires below the 30 level, a trend filter, or a 4-hour timeframe. Each variation needs its own backtest before it earns a place in a live strategy.
Run these Stochastic settings yourself and test the variations on CoinQuant. Test Stochastic on Bitcoin free on CoinQuant
Disclaimer:
Key Takeaway
