
Slow Stochastic Strategy on Bitcoin: Out-of-Sample Backtest Results (2023-2026)
Most stochastic backtests share a hidden flaw: the parameters were tuned on the same data they are then tested on. This article does the opposite. This slow stochastic strategy backtest on Bitcoin uses fixed, standard settings, and the backtest window, January 2023 to August 2026, is entirely out of sample: the strategy never saw this window during parameter selection.
The strategy is a named entry in the CoinQuant Strategy Library, Slow Stochastic OOS Jan2023-Jul2026 1D, so any reader can open it and reproduce the run. This is the same out-of-sample discipline the robustness workflow uses in Monte Carlo and walk-forward validation, applied to a first-time indicator on Bitcoin.
What the Slow Stochastic Strategy Does
The Slow Stochastic is the smoothed version of the classic Stochastic oscillator. It tracks the closing price relative to its high-low range over a lookback period, and the "slow" version averages the raw %K line before comparing it to the %D signal line, which filters out the noise that makes the fast stochastic fire constantly.
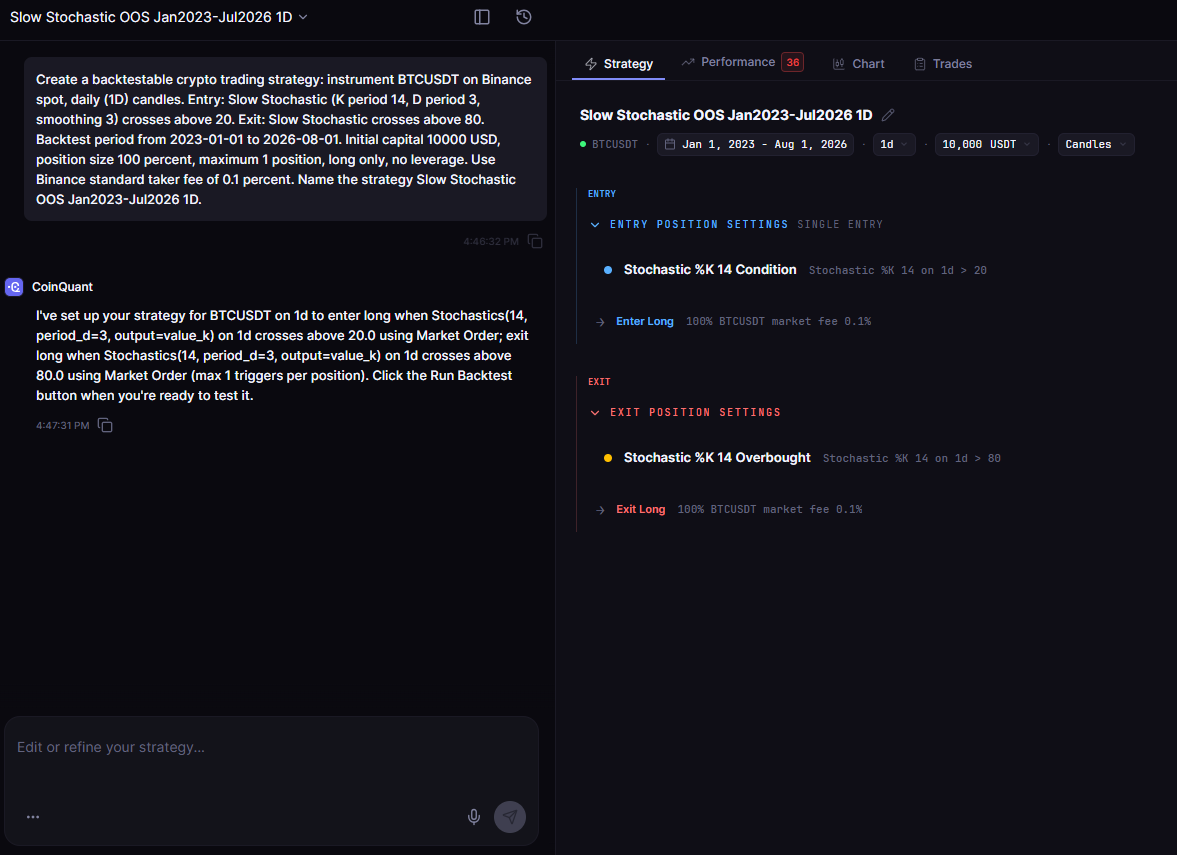
The strategy tested here uses the standard settings traders reference most often:
%K period: 14, with smoothing applied (the slow variant)
%D period: 3
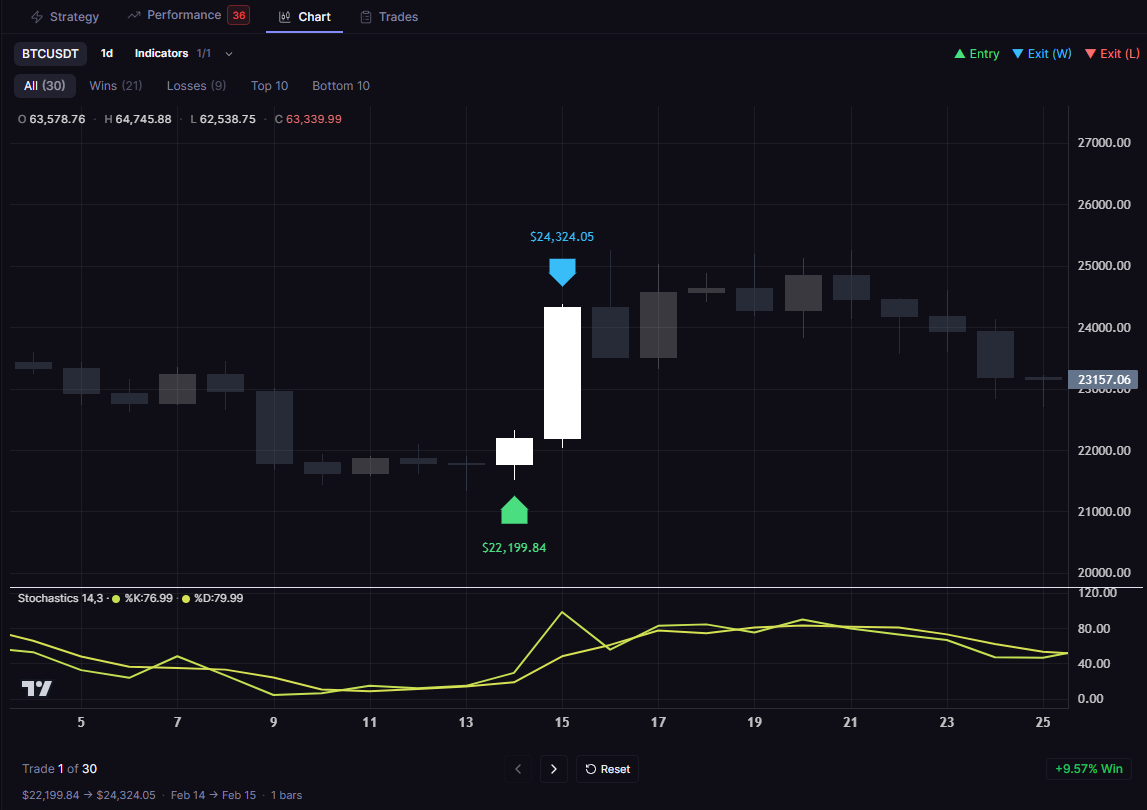
Entry: slow %K crosses above 20 (leaving oversold territory)
Exit: slow %K crosses above 80 (reaching overbought territory)
Direction: long only, no leverage, 100% position size, one position at a time
The idea is mechanical mean reversion: Bitcoin tends to bounce after an oversold reading, and the trade is closed once the oscillator reaches the other extreme.
Why Out-of-Sample Testing Matters Here
The 20 and 80 thresholds are the most common stochastic settings in the world, which is exactly why they make a fair out-of-sample test. No parameter was tuned on the test window, no threshold was optimized against the 2023-2026 data, and no variations were cherry-picked after seeing the results. The strategy is the standard configuration, run unchanged.
The discipline matters because mean-reversion strategies are the easiest to overfit. An optimizer can find thresholds that look spectacular on one window and collapse on the next. By fixing the parameters before the window opened, this test answers the question traders actually ask: does the plain, untuned slow stochastic hold up out of sample, or is the edge an artifact of tuning?
Test Setup
| Parameter | Setting |
|---|---|
| Strategy (library name) | Slow Stochastic OOS Jan2023-Jul2026 1D |
| Instrument | BTCUSDT (spot, Binance) |
| Timeframe | Daily (1D) |
| Out-of-sample period | Jan 2023 to Aug 2026 |
| Entry | Slow %K crosses above 20 |
| Exit | Slow %K crosses above 80 |
| Settings | K 14, D 3, smoothing 3 |
| Fees | Binance standard taker, 0.1%, included |
| Initial capital | $10,000 |
Slow Stochastic Strategy Backtest Results
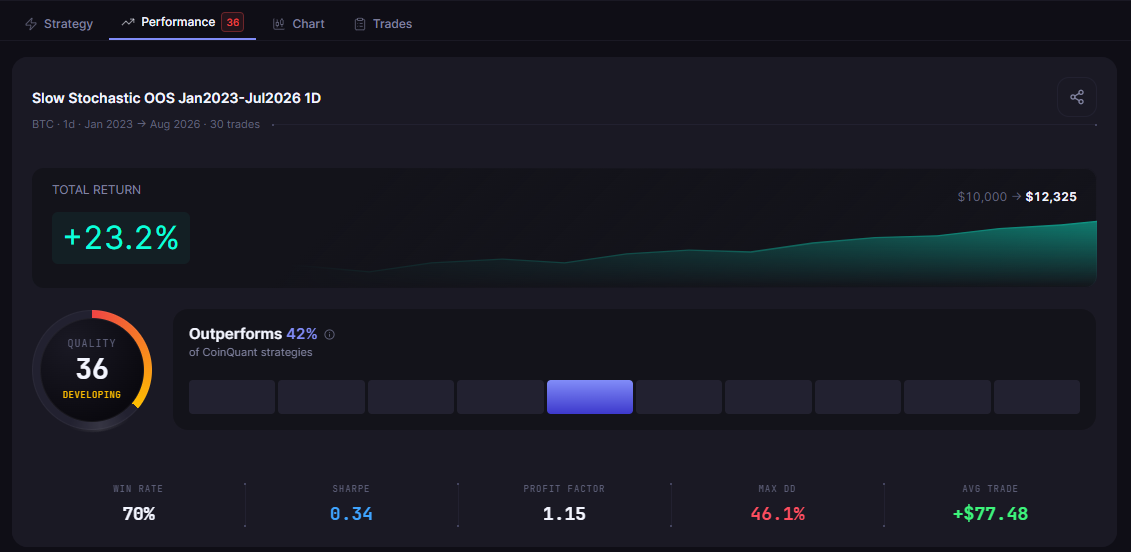
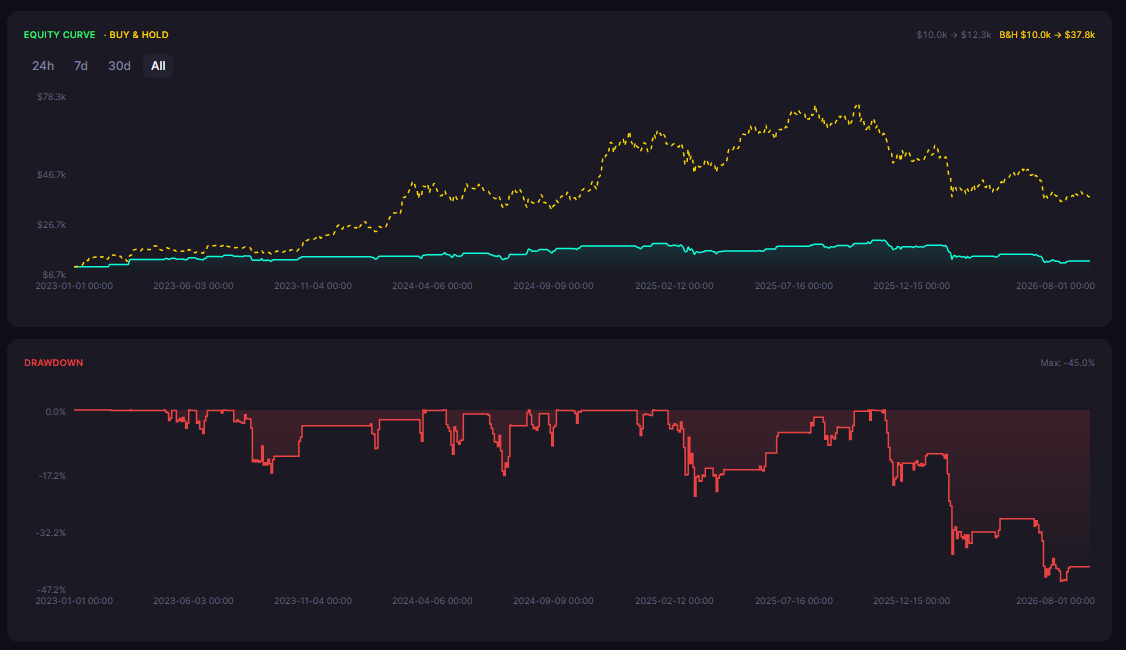
Over the out-of-sample window, the strategy turned $10,000 into $12,325, a +23.25% total return across 30 trades.
| Metric | Result |
|---|---|
| Total Return | +23.25% ($10,000 to $12,325) |
| Total Trades | 30 |
| Win Rate | 70.0% |
| Profit Factor | 1.15 |
| Sharpe Ratio | 0.34 |
| Max Drawdown | 46.06% |
| Total Fees | $956.13 |
| Consecutive Wins | 6 |
| Consecutive Losses | 2 |
| Best Day | +$5,907.60 |
| Worst Day | -$3,333.67 |
What the Data Shows
The headline number is the 70% win rate, the highest of any strategy published in the Week 12-13 backtest series on Bitcoin. The strategy won 21 of 30 trades, with a six-trade winning streak at its best and never losing more than two in a row.
The qualifying number is the profit factor of 1.15. A 70% win rate with a 1.15 profit factor means the wins are small relative to the losses: the strategy banks the frequent oversold bounces and occasionally gives back a large chunk when a bounce fails. The average winning trade is meaningfully smaller than the average losing trade, which is the standard mean-reversion profile.
The uncomfortable number is the 46.06% max drawdown. A mean-reversion strategy that holds through a failed bounce can sit deep underwater, and the 2024-2025 period produced exactly that: oversold readings that kept getting more oversold. The strategy recovered, which is what the positive total return shows, but the drawdown is the real cost of the 70% win rate.
The Out-of-Sample Verdict
The plain slow stochastic, untuned, made money on Bitcoin out of sample. That is a genuine finding, and it is more than most tuned stochastic strategies can claim, because most of them never get tested honestly.
The honest reading of the numbers:
The edge survived the test. +23.25% with a 1.15 profit factor over 3.5 years is a real, if modest, positive expectancy
The edge is not strong enough to trade on its own. A 1.15 profit factor and 46% drawdown would fail most serious robustness filters
The high win rate is a psychological trap. 70% wins feels great and compounds slowly; the drawdowns are where the risk lives
The practical conclusion is that the slow stochastic works best as a component, not a standalone system: as an entry filter inside a trend strategy, or combined with a regime filter that keeps it out of prolonged downtrends. The range-bound stochastic study and the StochRSI analysis reach the same conclusion from different angles.
Why Out-of-Sample Evidence Is the Differentiator
Every strategy in the CoinQuant library carries its metrics publicly, and the OOS designation is the difference between a backtest and a finding. A strategy labeled OOS has a fixed window boundary: the parameters were set before the window opened, and the results are the out-of-sample outcome, not the tuning result.
That is the same distinction the robustness workflow enforces with walk-forward analysis, and it is the reason this strategy is named for its window. Any trader can verify the claim by opening the strategy page and checking the backtest period: if the window starts after the parameters were fixed, the result is honest evidence. That standard, applied to a first-time indicator, is what makes this backtest worth publishing, because it is the kind of number no bot platform produces.
The skeptical reading is equally important to state. An out-of-sample test of one fixed configuration is not a guarantee, and the profit factor of 1.15 leaves little margin. What the OOS result does is shift the burden of proof: the strategy has survived the test it was never tuned on, and any trader who wants to dismiss it now has to explain why, instead of assuming the numbers were curve-fit.
The Practical Lesson
The untuned slow stochastic survived out-of-sample testing on daily Bitcoin: +23.25%, 70% win rate
The profit factor of 1.15 is positive but thin; the edge is real, not decisive
The 46.06% drawdown is the price of the high win rate
The strategy is best used as a filter inside a larger system, not as a standalone edge
The next step is to test the combination: slow stochastic entry with a trend filter, or with a drawdown-based position size. Each variation needs its own backtest, and each one runs in minutes on CoinQuant, with the full metric set reported every time.
Disclaimer:
Key Takeaway
