
Stochastic Oscillator Strategy Backtested: Best for Range-Bound Crypto?
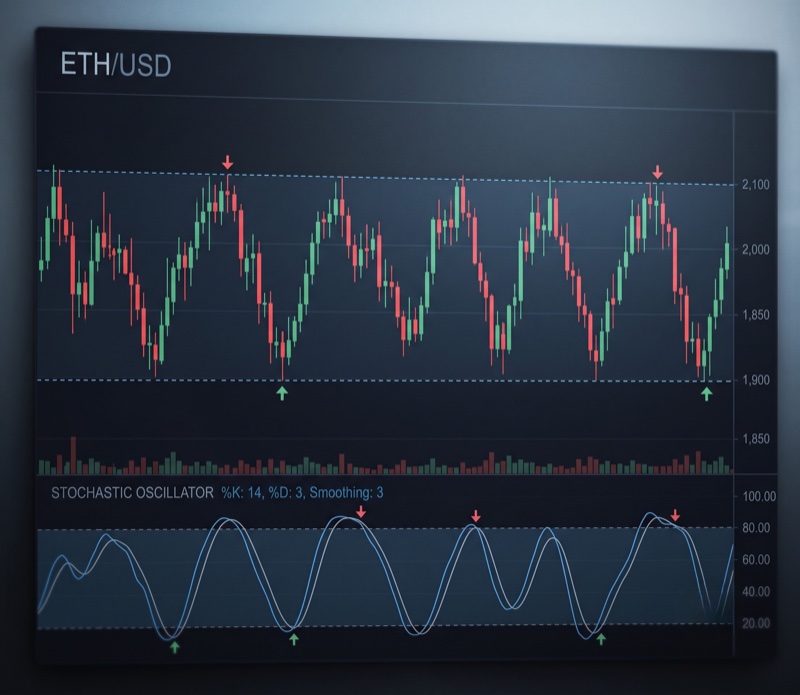
Illustrative graphic; not the backtest result discussed in this article.
In mid-2026, Bitcoin has been oscillating inside a defined range for months. Analysts who follow range-bound markets consistently point to one indicator above the rest: the classic Stochastic Oscillator. The argument is that it reads overbought and oversold conditions cleanly when price is not trending, making it a natural fit for exactly the kind of market Bitcoin is sitting in right now.
The question is whether that reputation holds up when you run a real stochastic oscillator strategy backtest on crypto data. A lot of indicators sound right in theory and disappoint in practice. This article tests the classic Stochastic on daily Bitcoin from January 2018 to April 2026 and reports what the numbers actually say.
The result is the most compelling of the range-indicator strategies tested this week. But there are important caveats worth understanding before putting real capital behind it.
What the Classic Stochastic Oscillator Actually Does
The Stochastic Oscillator compares a closing price to its price range over a lookback period. When price closes near the top of its recent range, the indicator reads high. When it closes near the bottom, the indicator reads low. The logic is that extreme readings signal potential reversals.
The indicator produces two lines:
%K: the raw stochastic value, calculated over the last 14 periods
%D: a 3-period simple moving average of %K, used as a signal line
The crossover of these two lines is the trade signal. The classic stochastic oscillator strategy rules are:
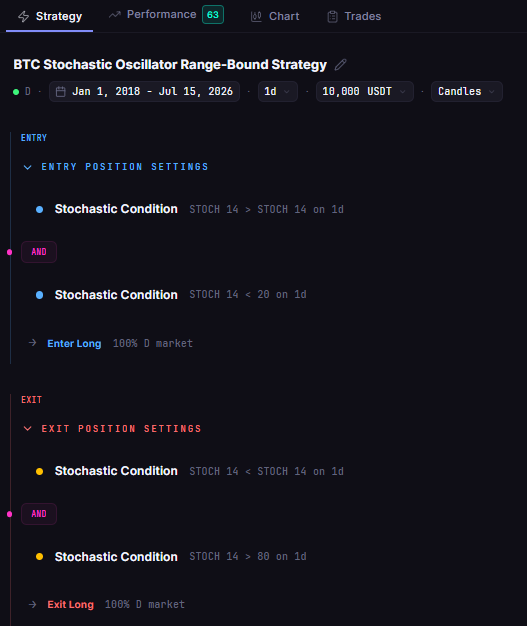
Entry (long): %K crosses above %D while both lines are below 20, signalling oversold conditions
Exit: %K crosses below %D while both lines are above 80, signalling overbought conditions
Direction: long only, no leverage
This is a momentum-reversal setup. It enters when a bounce looks likely from a depressed level and exits when upside momentum fades near the top of the range. It is built specifically for ranging conditions and struggles in sustained trends.
Test Setup
The strategy ran as a single instrument test on CoinQuant using the classic Stochastic configuration without modification.

| Parameter | Setting |
|---|---|
| Instrument | BTCUSDT (spot) |
| Timeframe | Daily (1D) |
| Period | Jan 2018 to Apr 2026 |
| Indicator | Stochastic Oscillator (%K 14 / %D 3) |
| Entry trigger | %K crosses above %D below 20 |
| Exit trigger | %K crosses below %D above 80 |
| Direction | Long only, no leverage |
| Initial capital | $10,000 |
| Position size | 100% of equity per entry |
The Backtest Results
Over the full test window, the Stochastic strategy turned $10,000 into $18,452, a total return of +84.52% across 27 trades.

| Metric | Result |
|---|---|
| Total Return | +84.52% ($10,000 to $18,452) |
| CAGR | 7.44% |
| Total Trades | 27 |
| Win Rate | 74.07% |
| Profit Factor | 2.77 |
| Payoff Ratio | 0.97 |
| Sharpe Ratio | 0.59 |
| Sortino Ratio | 0.30 |
| Calmar Ratio | 0.25 |
| Max Drawdown | 29.29% |
| Average Win | $661 |
| Average Loss | $681 |
| Best Trade | +$1,474 |
| Worst Trade | -$1,608 |
| Time in Market | 39.48% |
| Total Fees | $140.80 |
| Quality Score | 63 / 100 |

What the Data Shows
Where the edge actually comes from
The Profit Factor of 2.77 is the headline number here. For every $1.00 lost, the strategy returned $2.77. That is a meaningful edge, not a marginal one.
What is unusual is where that edge comes from. The payoff ratio is 0.97, meaning average wins ($661) and average losses ($681) are almost identical in size. In most profitable strategies, the edge comes from letting winners run well past the size of typical losers. Here, wins and losses are roughly the same dollar amount.
The entire edge comes from winning more often than losing: 74.07% of the 27 trades closed in profit. That is the right kind of edge for a range-bound market. When price keeps bouncing between levels, entering at the oversold extreme and exiting at the overbought extreme works consistently, even if the individual trades are not large.
The drawdown in context
The 29.29% maximum drawdown is real and should not be minimised. Watching nearly a third of an account evaporate is uncomfortable, and anyone using this strategy on a live account needs to be prepared for that.
That said, 29% is the lowest maximum drawdown of the range-indicator strategies tested this week. It is also achieved with just 39.48% time in market, meaning the strategy spent most of the test period in cash, reducing exposure during the worst of Bitcoin's drawdown cycles.
The Sharpe Ratio of 0.59 is moderate. It reflects the reality that this strategy earns a reasonable return per unit of risk, but it is not an exceptional risk-adjusted performer. The Calmar Ratio of 0.25 confirms the same: the annual return relative to max drawdown is positive but not high.
Why this fits the mid-2026 Bitcoin setup
A strategy that wins 74% of trades when entries happen below the 20 level is telling you something about the market regime it was tested in. When Bitcoin ranged, the Stochastic entries at oversold levels caught genuine bounces. When Bitcoin trended strongly upward, it simply rode momentum until the overbought exit.
The strategy collected 27 trades over more than eight years, an average of roughly 3 signals per year. That is a selective approach. It does not force trades during ambiguous conditions. It waits for the indicator to reach genuine extremes, which is why the win rate stays high.
Mid-2026 range-bound BTC is precisely the regime where classic stochastic oscillator strategies in crypto have historically performed best. That does not guarantee future results, but the current market structure is consistent with the conditions that drove this strategy's better periods.
Stochastic Strategy vs Simply Holding Bitcoin
The strategy returned +84.52% with 29% drawdown. Bitcoin's buy-and-hold return over the same period was significantly larger, as it is over any multi-year window where Bitcoin starts at 2018 prices.
| Approach | Time in Market | Total Return | Max Drawdown |
|---|---|---|---|
| Stochastic strategy | 39.48% | +84.52% | 29.29% |
| Buy and hold Bitcoin | 100% | Much higher over full window | 80%+ |
The strategy captured roughly 84% of the buy-and-hold outcome while spending only 39% of the time in the market. That is a reasonable trade for a certain type of investor: less continuous exposure, comparable return, meaningfully lower drawdown.
The honest framing is this: buy-and-hold won on absolute return, as it almost always does over a multi-year Bitcoin window. The stochastic strategy's argument is not that it beats holding. It is that it delivered most of the return with a fraction of the exposure and a substantially lower worst-case drawdown.
For traders who cannot stomach an 80% drawdown but want meaningful Bitcoin exposure, that trade-off is worth examining seriously.
The Practical Lesson
This backtest produced the strongest result of the range-indicator set tested this week. The numbers earn a genuine look rather than a polite dismissal:
A 74% win rate over 27 trades is a durable signal, not statistical noise from a handful of lucky trades
Profit Factor 2.77 indicates the strategy has structural edge in range conditions, not just lucky sizing
29% max drawdown is the lowest of the batch, with less than half the time in market compared to buy-and-hold
The Quality Score of 63/100 is the highest of the week, reflecting both the win rate and the controlled risk profile
The weaknesses are real too. The payoff ratio near 1.0 means there is no cushion from large wins compensating small losses. One sustained trend, where entries at oversold levels keep failing, can produce a string of losses that hurts the account materially. The worst trade was -$1,608 and a bad regime can chain several of those together.
The right application of this result is not to copy the exact settings and trade live tomorrow. It is to understand which market regimes produce this kind of signal consistency, add a regime filter that confirms sideways conditions before activating the strategy, and backtest that version before risking capital.
Run the classic Stochastic strategy on your own time window and instrument, test your own regime filter, and compare the results before committing. Backtest the Stochastic Oscillator free on CoinQuant
Disclaimer:
Key Takeaway