
How We Test Crypto Strategies: The Settings Behind Every Backtest on This Blog and How to Check Them
Backtesting methodology is the fixed list of settings used to run every test: the data, the window, the capital, the position size, the fees and the benchmark. On this blog, every backtest runs on CoinQuant, an AI trading platform where a strategy is written in plain English with no coding required. Each run's settings and trade log can be opened and checked.
This page publishes that list. It also shows how to check any result we report, using one real run: BTC Buy and Hold 1D 2021-2026, the Bitcoin benchmark in our Prove It articles. It returned 57.33% from 2021-08-01 to 2026-08-01 after $25.74 in fees.
The author ran every backtest cited here on CoinQuant. Nothing below is tuned after the fact.
Why We Publish Our Backtesting Methodology
A backtest result is a claim. A method is something you can repeat, and a repeated method is the best proof a reader can get.
- Readers can check a method: build the same rule with the same settings and compare the numbers.
- Settings change results: a different window, fee or venue can turn a gain into a loss.
- Exceptions get hidden: a published default makes any change easy to spot.
So each article states its settings, and this page states the defaults. If you are comparing tools rather than methods, see what to check in backtesting software reviews.
The Settings List, and When an Article Differs
These are the defaults for the Prove It backtests on this blog that use 2021 to 2026 windows. Our earlier articles used other windows, and each one states its own.
| Setting | Our default | When an article differs |
|---|---|---|
| Strategy | The exact library name, for example BTC Buy and Hold 1D 2021-2026 | Never: the name in the article is the name in the library |
| Market data | Binance spot, Kaiko via CoinQuant | A venue comparison used Coinbase BTCUSD and a stock comparison used AAPL; each article says so |
| Window | 2021-08-01 to 2026-08-01 | Shorter tests start in 2024; the article gives the dates |
| Timeframe | Daily (1D) | Some Bitcoin tests use 4h bars |
| Initial capital | $10,000 | None in the runs we cite |
| Position size | 100% of equity per entry | None in the runs we cite |
| Positions | One at a time, long only, no leverage | None in the runs we cite |
| Fees | 0.1% on entry and 0.1% on exit | Library records with no stored fee were charged 0.02% a side; the article says so |
| Slippage | Not modelled | Stated in every article |
| Baseline | The same coin's Buy and Hold strategy, plus BTC Buy and Hold 1D 2021-2026 | Same window and fee as the strategy |
| Sample | 50+ trades before we lean on the Quality number | Smaller runs are labelled "Statistically inconclusive" |
Two records we cite, AAPL Buy and Hold 1D 2021-2026 and BTC Bollinger Mean Reversion 1D 2021-2026, have no stored fee and were charged 0.02% a side. Any article that uses them says so next to the results.
Fees are included on every fill. No slippage was modelled, so fills in a fast market could be worse than the test shows.
How Our Buy and Hold Comparison Is Built
Every Prove It result sits next to holding the coin. We do not use the platform's own Buy and Hold figure for that. We use a library strategy that buys on the first bar and holds, so it pays the same fees as the strategy it is compared with.
- Entry: the stored rule buys when the daily close is greater than 0, which is true on the first bar, with a 100% position size.
- Exit: there is no exit rule. The position is closed at the end of the test, on 2026-08-01.
- Fees: 0.1% on the buy and 0.1% on the sell, like the strategies.
| Metric | BTC Buy and Hold |
|---|---|
| Strategy | BTC Buy and Hold 1D 2021-2026 |
| Total Return | 57.33% |
| Final Balance | $15,733.43 |
| Total Trades | 1 |
| Max Drawdown | 76.63% |
| Sharpe Ratio | 0.44 |
| CAGR | 9.48% |
| Total Fees | $25.74 |
CAGR is the steady yearly rate that turns $10,000 into the final balance over the five years. The platform's own Buy and Hold benchmark carries no fees and ends at 57.65%, so our tables use BTC Buy and Hold 1D 2021-2026 (57.33%), which pays the 0.1% fee on entry and exit.
On the Strategy tab, the stored setup and the single entry rule are visible. The app shows the strategy as BTC Buy and Hold, the engine name saved with it.
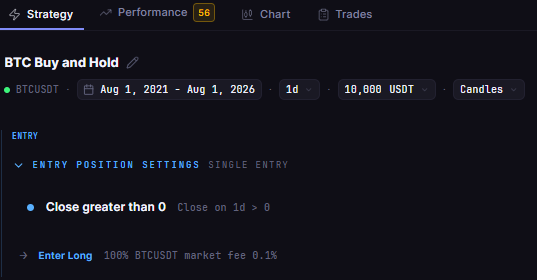
How the Buy and Hold benchmark is stored: BTC Buy and Hold 1D 2021-2026 (shown in the app as BTC Buy and Hold) buys when the daily close is greater than 0.
The 50-Trade Line and the Quality Score
Every results card on the Performance tab shows a QUALITY number. With 50 or more trades, it sits next to a box that reads "Outperforms N% of CoinQuant strategies". Under 50 trades, it sits next to a box marked "Statistically inconclusive", with the line "N trades · needs 50+ to rate".
We follow the card. A run with 50+ trades gets a reading of its Quality number; a smaller run is reported, but labelled "Statistically inconclusive" in the text, and we do not draw a verdict from it.
The benchmark itself is the clearest case. BTC Buy and Hold 1D 2021-2026 is one trade, so its card shows a QUALITY of 56 next to "Statistically inconclusive" (1 trade · needs 50+ to rate). A single hold is a baseline, not a strategy to rate.
For why trade counts matter, read how many trades a backtest needs before you can trust it.
How to Check Any Result Yourself
This is how to test a trading strategy fairly, or check one we report. Here is a plain-English request that describes our benchmark, as you would type it into CoinQuant:
Buy BTCUSDT on the daily chart on the first bar, with 100% of equity, and hold to the end of the test. Test from August 1, 2021 to August 1, 2026 with $10,000 and a 0.1% fee on entry and exit.
Then check the run in five steps:
- Match the name: check that the header names the strategy you meant to open. The app can show a shorter engine name, as it does here.
- Read the settings: on the Strategy tab, confirm the pair, timeframe, window, capital and size. The end date can show in your local time.
- Check the fee: on the Trades tab, divide each row's Fee by its Size (USDT). Here, $9.99 on $9,990.01 and $15.75 on $15,749.18 are both 0.1%.
- Count the orders: the log lists orders, not trades. Each trade is an Entry row and an Exit row, with times in UTC.
- Compare with holding: set the result next to the same coin's Buy and Hold on the same window and fee.
The benchmark's log has two order rows. Row 1 is the Entry on 1 August 2021, and row 2 is the Exit on 1 August 2026, with a Net PnL of $5,733.43.

One trade, two order rows, a fee on each side (UTC): BTC Buy and Hold 1D 2021-2026 (shown in the app as BTC Buy and Hold), a Filled Entry on 1 August 2021 and a Filled Exit on 1 August 2026.
Common Mistakes When Checking a Backtest
- Comparing different windows: a five-year result and a two-year result answer different questions.
- Ignoring the fee: a run with no stored fee can look better than one that pays 0.1% a side.
- Reading rows as trades: a log of two orders is one trade, not two.
- Trusting a small sample: a card marked "Statistically inconclusive" is a starting point, not a verdict.
- Skipping the benchmark: a gain that trails holding the coin is not an edge.
For how traders who do not code use a crypto strategy tester, see crypto strategy testers in 2026.
The Practical Lesson
- Publish the defaults: window, venue, capital, size, fees and benchmark, then state every exception.
- Benchmark with fees: BTC Buy and Hold 1D 2021-2026 paid $9.99 to buy and $15.75 to sell, like any strategy.
- Check from the log: the Trades tab shows the fee, the dates and the Net PnL behind each number.
Build any rule we publish in CoinQuant, then read its Strategy tab and Trades tab. That is how to repeat the check on any crypto backtesting result we publish.
Build trading strategies on real data. No coding required.
Frequently Asked Questions
How should a crypto strategy be backtested?
With fixed settings stated up front: the data, window, capital, position size and fees, plus a Buy and Hold baseline on the same window and fee. Our defaults are Binance spot data, 2021-08-01 to 2026-08-01, $10,000, 100% of equity and 0.1% a side. Change one setting at a time and say so.
What is a crypto strategy tester?
It is a tool that runs a trading rule over past prices and reports what it would have done, including trades, fees and drawdowns. CoinQuant is one such tool: you write the rule in plain English and read the result on the Performance tab and the Trades tab.
Why compare a backtest with buy and hold?
Because holding the coin is the simplest alternative. If a strategy trails Buy and Hold on the same window and fee, it added work without adding return. BTC Buy and Hold 1D 2021-2026 returned 57.33% after fees from 2021 to 2026.
Write one rule in plain English, then check its settings and trade log the same way.
Disclaimer:
Key Takeaway