
How to Check a Backtest Result Yourself: Rebuild the Return From the Trade Log

A backtest card gives you one headline number, and the only way to trust it is to rebuild it. This is how to verify a backtest by hand: take every order from the trade log, work out each trade's net result after fees, and compound from the starting balance until you reach the final figure.
We did that for a BNB strategy with three trades that the author ran on CoinQuant. Adding the three nets after fees to $10,000 gives $11,926.70, a Total Return of 19.27%, which matches the card to the cent.
The method needs only the trade log and a calculator, and it works on any tool that exports its trades. Here it is step by step, with the figures reported without adjustment.
Why Learn How to Verify a Backtest Yourself
Backtesting software is a tool that applies a trading rule to historical prices and reports what the rule would have done, trade by trade. CoinQuant, an AI trading platform, is one such tool: you describe a strategy in plain English with no coding required, and every run comes with a Trades tab that lists each order.
A headline return published by the tool that produced it is a claim, not a proof. Rebuilding it from the orders turns the claim into arithmetic you did yourself, and it catches three common problems:
- Missing fees: a return that only adds up without fees was not charged them.
- Wrong compounding: a return that assumes a fixed stake when the rule reinvests, or the reverse.
- Rows that do not add up: an exit that does not match its entry, or a balance that jumps between trades.
The worked example is BNB 52-Week High Breakout 1D 2021-2026. Written as a plain-English request, its stored rule reads:
Buy BNBUSDT on the daily chart when the close crosses above the highest high of the previous 365 days. Sell when the close crosses below the lowest low of the previous 50 days. Test from August 1, 2021 to August 1, 2026 with $10,000, 100% of equity per trade and a 0.1% fee on entry and exit.
It made only three trades in five years, which keeps the arithmetic short.
What You Need From the Trade Log
The Trades tab shows a Trade Log with an order count, a date range and a CSV button for export. Each row is one order, not one trade, so a finished trade takes two rows: an Entry and an Exit. Times are in UTC.
For a hand check you need four columns from every row:
- Side: Entry or Exit, so you can pair the rows into trades.
- Price: the fill price of the order.
- Size (USDT): the value of the order at that price.
- Fee: what the order cost to fill.
The Net PnL and PNL % columns on each Exit row are the platform's answers; you check your own numbers against them. Before you start, check that every row says Filled, because a cancelled or rejected order is a row too.
The example's log holds six orders, all Filled: an Entry and an Exit for each of the three trades.
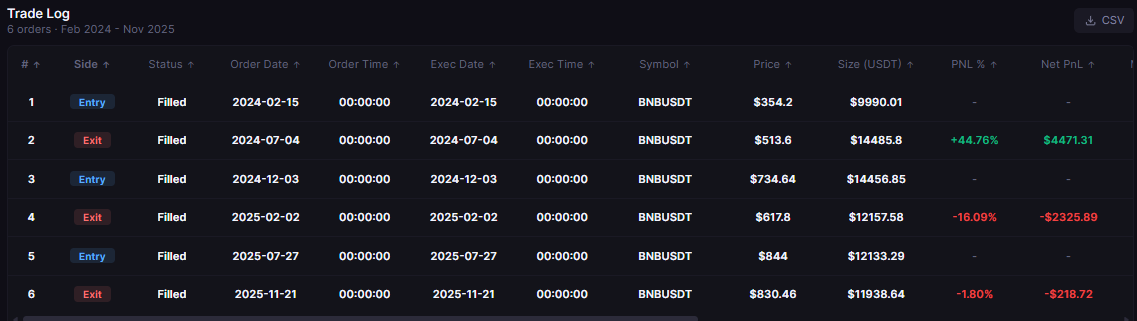
All six order rows behind a backtest with three trades: Entry and Exit rows from 15 February 2024 to 21 November 2025, all Filled (UTC)
Step by Step: Net Result per Trade
Take the trades one at a time. For each one:
- Cost: read the Size (USDT) of the Entry row. That is what the position cost before its fee.
- Entry fee: read the Fee of the Entry row. Here it is 0.1% of the cost.
- Proceeds: read the Size (USDT) of the Exit row, the value of the same position at the exit price.
- Exit fee: read the Fee of the Exit row, again 0.1%.
- Net after fees: proceeds minus cost minus both fees.
Here is our arithmetic for the three trades (dates in UTC):
| Trade | Entry to exit | Prices | Cost | Proceeds | Fees (entry + exit) | Net after fees |
|---|---|---|---|---|---|---|
| First | 2024-02-15 to 2024-07-04 | $354.20 to $513.60 | $9,990.01 | $14,485.80 | $9.99 + $14.49 | $4,471.31 |
| Second | 2024-12-03 to 2025-02-02 | $734.64 to $617.80 | $14,456.85 | $12,157.58 | $14.46 + $12.16 | -$2,325.89 |
| Third | 2025-07-27 to 2025-11-21 | $844.00 to $830.46 | $12,133.29 | $11,938.64 | $12.13 + $11.94 | -$218.72 |
Take the first trade: $14,485.80 minus $9,990.01, minus $9.99, minus $14.49 leaves $4,471.31, the same figure as the Net PnL on its Exit row. The other two match their Exit rows the same way. Unrounded, the six fees add up to $75.16, the run's Total Fees; the fees in the table, rounded to the cent, add up to one cent more.
A useful extra check: the cost of the first trade plus its entry fee is $9,990.01 plus $9.99, exactly the starting $10,000. That confirms the rule put 100% of the balance into the trade, fee included.
Compounding to the Final Balance
The rule reinvests everything, so each trade starts from the balance the previous one left. Chain the nets in date order:
| Step | Balance |
|---|---|
| Starting capital | $10,000.00 |
| After the first trade (+$4,471.31) | $14,471.31 |
| After the second trade (-$2,325.89) | $12,145.42 |
| After the third trade (-$218.72) | $11,926.70 |
| Total Return | 19.27% |
The rebuilt $11,926.70 and 19.27% match the card, which shows +19.3% and $10,000 → $11,927. Each next trade's cost plus entry fee also equals the balance before it: $14,456.85 plus $14.46 is $14,471.31, and $12,133.29 plus $12.13 is $12,145.42.
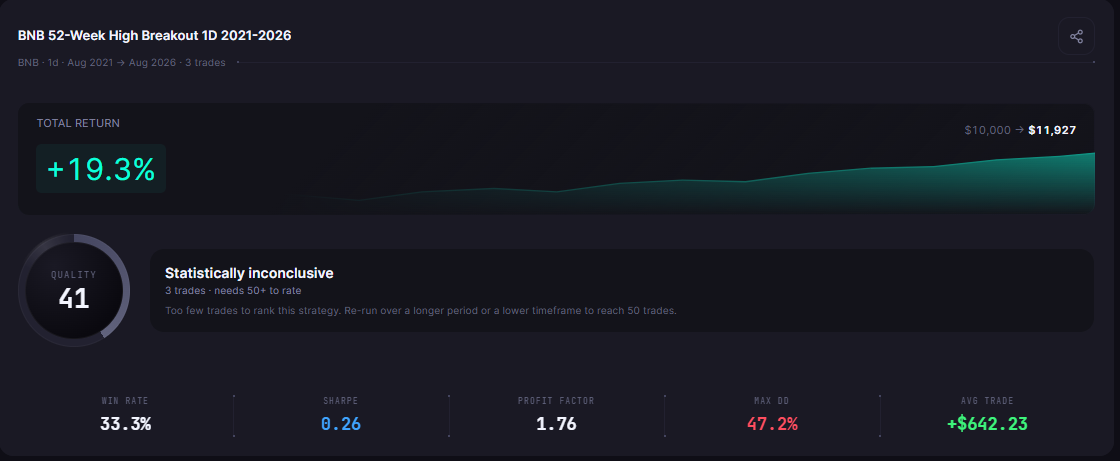
The two numbers to match: Total Return and the final balance. BNB 52-Week High Breakout 1D 2021-2026, three trades, +19.3%, $10,000 to $11,927, QUALITY 41 next to "Statistically inconclusive"
Common Mistakes
- Chaining the PNL % column: it reads 44.76%, -16.09% and -1.80%, and compounding those three gives 19.28%, not 19.27%. Each PNL % is measured on the position cost, a base that leaves out the entry fee paid from the balance, so chaining them runs slightly high; rebuild from the dollar nets instead.
- Counting rows as trades: six orders are three trades.
- Dropping one side of the fee: each trade pays on entry and on exit.
- Using a fixed stake: this rule reinvests the whole balance, so every trade starts where the last one ended.
What a Hand Check Cannot Tell You
A matching rebuild proves the arithmetic, not the strategy. With three trades, the card shows its QUALITY number (41) next to "Statistically inconclusive" (3 trades · needs 50+ to rate), and that is the right reading: one winner and two losers say nothing about an edge.
The check also leaves some questions open:
- Prices: it uses the platform's fills. To check them, compare a few rows with the exchange's daily candles.
- Signals: it does not show whether the rule fired on the right days. Read the stored rule on the Strategy tab for that.
- Costs: fees are included on entry and exit; no slippage is modelled.
For the strategy behind the example, see the 52-week high breakout on BNB. For the rest of the card, how to read a backtest report explains every metric, and average trade vs median trade shows why one big winner can carry an average.
The Practical Lesson
- Rebuild from dollars: cost, proceeds and both fees per trade, then compound from the starting balance.
- Match two numbers: the final balance and the Total Return on the card.
- Do not chain the PNL % column: its base leaves out the entry fee, so it runs slightly high.
In CoinQuant every backtest has a Trades tab with a CSV button, so the same short check works on a strategy with three trades or three hundred.
Build trading strategies on real data. No coding required.
Frequently Asked Questions
How do I verify a backtest?
Take every order from the trade log, work out each trade's net as proceeds minus cost minus both fees, and add the nets to the starting balance in date order. If the result matches the card's final balance and Total Return, the arithmetic holds.
Why does my compounded trade return differ from the Total Return?
On the Trades tab, each trade's PNL % is measured on the position cost, a base that leaves out the entry fee. Chaining those percentages therefore runs slightly high: 19.28% against 19.27% in our example.
What should a backtest trade log include?
Every order, not only every trade: the side, status, date and time in UTC, fill price, order size and fee, plus the net result on each exit.
Pick a strategy of your own and rebuild its return from the Trades tab.
Disclaimer:
Key Takeaway