
How Long Do Bitcoin Bear Markets Last? Three Cycles Measured
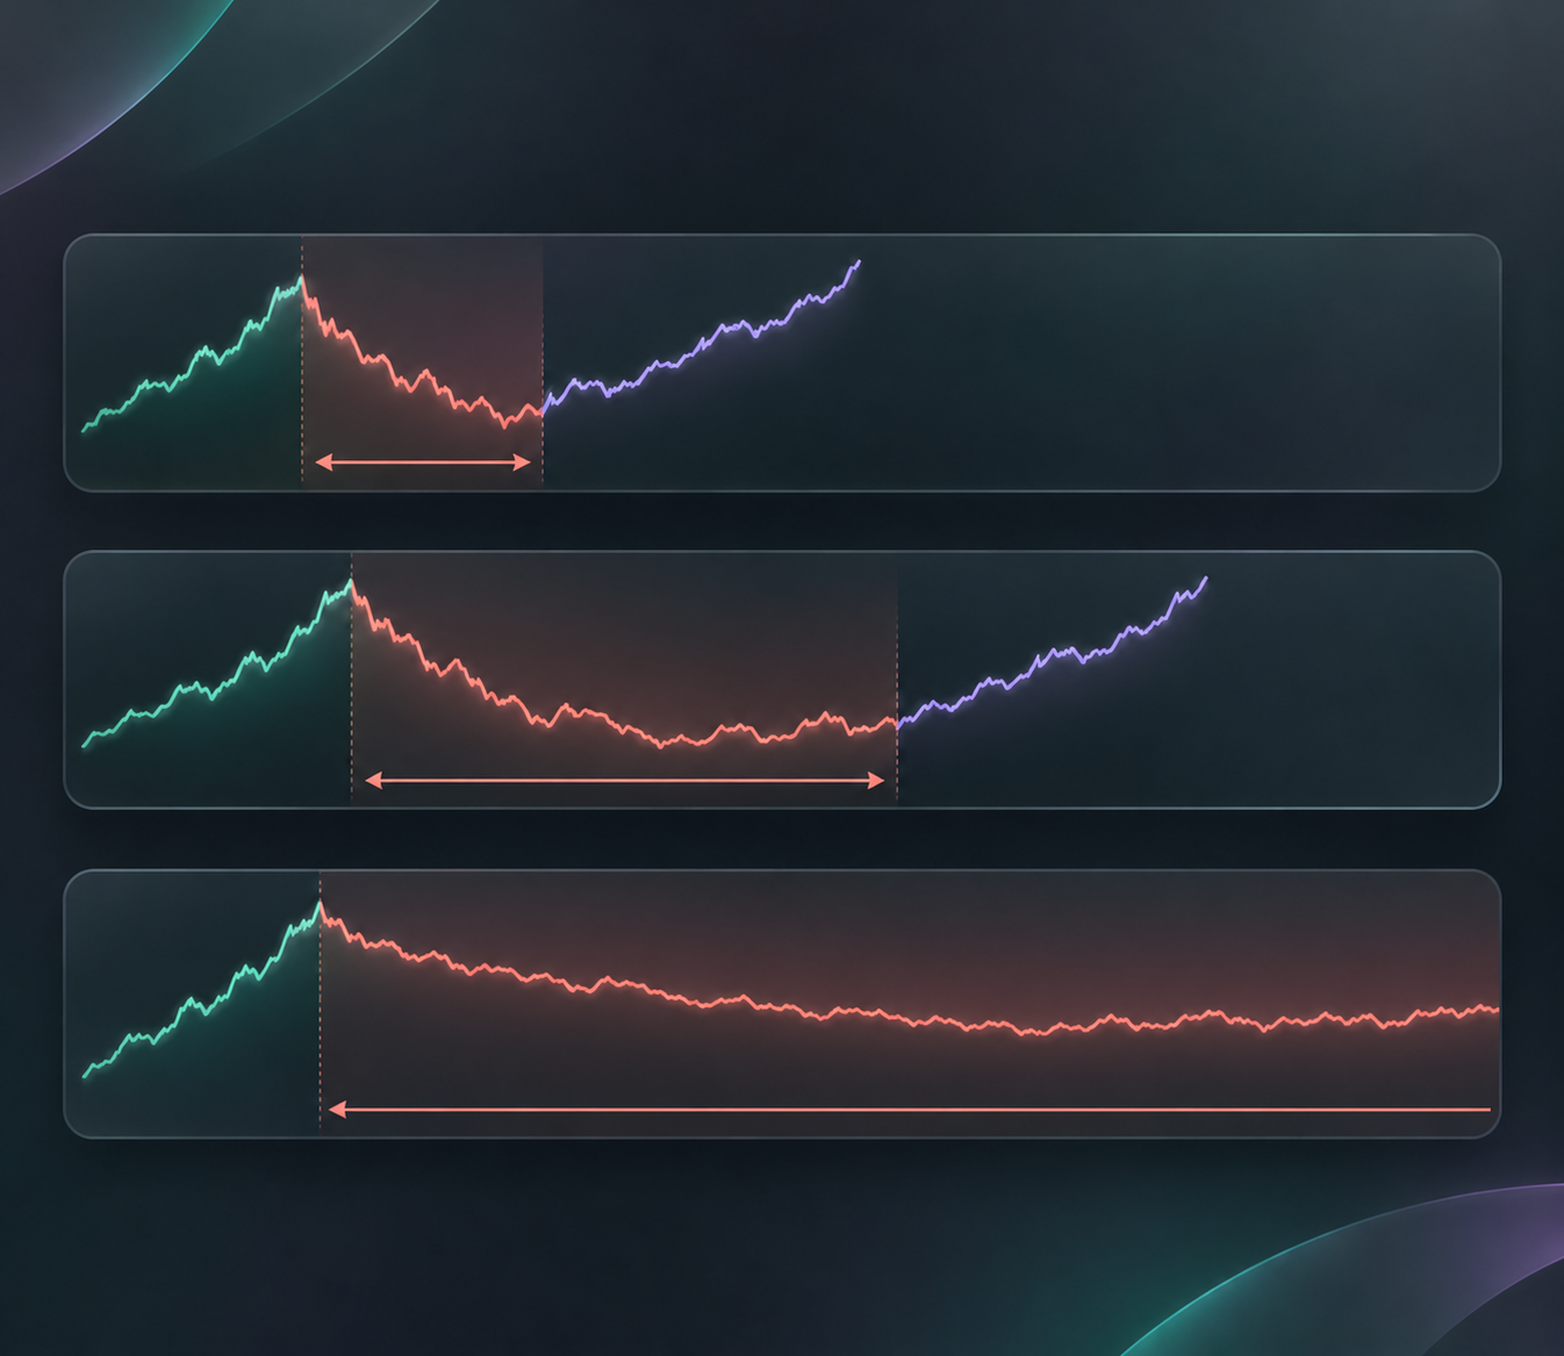
In CoinQuant's count of closed Binance daily candles, the last two Bitcoin cycles took 364 and 378 days to go from the peak close to the lowest close. This time the lowest close so far came 267 days after the 6 Oct 2025 peak, and on 5 Nov 2026 (day 395) Bitcoin closed 38.96% below that peak.
How long does a Bitcoin bear market last? Measured from the highest close to the lowest close, about a year in each of the last two cycles. This cycle has been shallower so far, and no daily close through 5 November 2026 went below its 30 June 2026 low.
This guide shows how we measured, puts the three cycles side by side and explains why three cycles cannot tell you when this one ends.
The Answer First: How Long Does a Bitcoin Bear Market Last?
The 2017 cycle peaked at a daily close of 19,102.66 on 16 December 2017 and reached its lowest close, 3,211.72, on 15 December 2018: 364 days and a fall of 83.19%.
The 2021 cycle peaked at a close of 67,525.83 on 8 November 2021 and reached its lowest close, 15,781.29, on 21 November 2022: 378 days and a fall of 76.63%.
This cycle peaked at a close of 124,658.54 on 6 October 2025. Its lowest close so far is 58,624.71 on 30 June 2026, 267 days later and 52.97% below the peak. On 5 November 2026, day 395, Bitcoin closed at 76,088.01.
How We Measured
Bitcoin bear market length depends on where you start and stop counting, so here is the method, step by step:
- Use closed daily candles: Binance BTCUSDT, UTC. Binance candles begin on 17 August 2017, so the 2013 to 2015 cycle is not in this count.
- Find the peak close: the highest daily close of the cycle, not the highest price reached during a day.
- Find the lowest close after it: the lowest daily close that followed the peak, again not the day's low.
- Count calendar days and the fall: days from the peak close to the lowest close, and the % change between the two closes.
- Mark open cycles as "so far": for this cycle, the lowest close is counted to the 5 November 2026 close.
Every figure in this article uses closes. The highs and lows reached during each day would give different numbers, usually a deeper fall.
You can repeat the depth part on CoinQuant, an AI trading platform, without code. Describe a simple hold in plain English, for example:
Buy BTCUSDT at the daily close on 1 August 2021 and hold it until 1 November 2026. Use a 0.1% fee on entry and exit.
Then read the Max Drawdown of the result. The section on drawdown below shows why it matches the fall measured on closes.
Cycle by Cycle: Depth and Days
| Cycle | Peak close | Lowest close after the peak | Days | Fall |
|---|---|---|---|---|
| 2017 to 2018 | 19,102.66 (16 Dec 2017) | 3,211.72 (15 Dec 2018) | 364 | -83.19% |
| 2021 to 2022 | 67,525.83 (8 Nov 2021) | 15,781.29 (21 Nov 2022) | 378 | -76.63% |
| 2025 to now | 124,658.54 (6 Oct 2025) | 58,624.71 (30 Jun 2026), so far | 267 so far | -52.97% so far |
Two patterns stand out, and both are thin. The first two falls took close to the same time, just over a year. Each fall has also been shallower than the one before: 83.19%, then 76.63%, then 52.97% so far.
The fall is only half of the wait. The 2017 peak close was not passed until 24 November 2020, 1,074 days after the peak. The 2021 peak close was passed on 4 March 2024, 847 days after it.
Where This Cycle Stands on Day 395
| Cycle | Day 395 | Close that day | Below the peak close |
|---|---|---|---|
| 2017 to 2018 | 15 Jan 2019 | 3,553.06 | -81.40% |
| 2021 to 2022 | 8 Dec 2022 | 17,224.10 | -74.49% |
| 2025 to now | 5 Nov 2026 | 76,088.01 | -38.96% |
In both earlier cycles, day 395 came a few weeks after the lowest close: 31 days after it in 2019 and 17 days after it in 2022. Bitcoin was still more than 70% below its peak close on that day both times.
This cycle looks different on the same day. On 5 November 2026 Bitcoin closed 38.96% below its peak, far above its 30 June low. As of that close, the lowest close of this cycle was still 58,624.71 on 30 June 2026.
That does not mean the low is in. It means the lowest close so far is more than four months old.
What a Backtest Drawdown Chart Shows About the Same Fall
A backtest of simply holding Bitcoin measures the same falls from a different angle. Its Max Drawdown is the largest fall from a running high in account value, and a daily backtest marks the account at daily closes, the same reference used above.
| Metric | Holding Bitcoin, 2021 to 2026 | Holding Bitcoin, 2023 to 2026 |
|---|---|---|
| Strategy | BTC Buy and Hold 1D Aug 2021-Nov 2026 | BTC Buy and Hold 1D 2023-2026 |
| Window | 2021-08-01 to 2026-11-01 | 2023-01-01 to 2026-08-01 |
| Total Return | 96.23% | 277.31% |
| Max Drawdown | 76.63% | 52.97% |
| Total Trades | 1 | 1 |
| Card | QUALITY 57, "Statistically inconclusive" | QUALITY 62, "Statistically inconclusive" |
BTC Buy and Hold 1D Aug 2021-Nov 2026 spans the whole 2021 to 2022 fall, and its Max Drawdown is 76.63%, the same as the fall measured on closes above. Despite that, it still made 96.23% by 1 November 2026. Both cards show "Statistically inconclusive" (1 trade · needs 50+ to rate), as any single hold does.
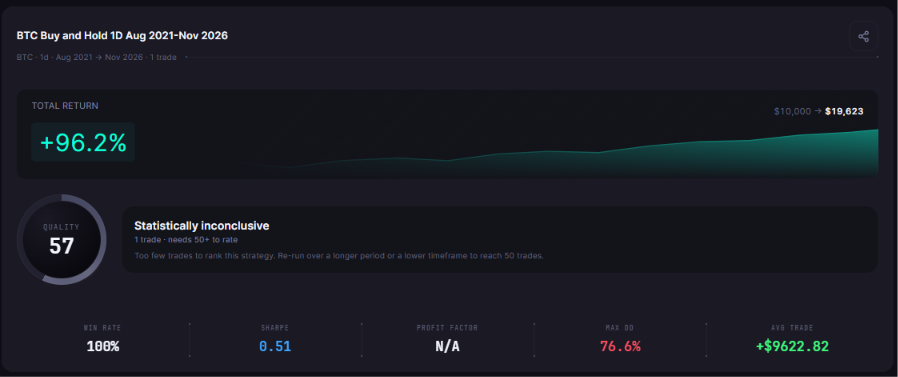
BTC Buy and Hold 1D Aug 2021-Nov 2026, tested from August 2021 to November 2026: one trade, +96.2%, $10,000 to $19,623, MAX DD 76.6% and QUALITY 57 next to "Statistically inconclusive".
BTC Buy and Hold 1D 2023-2026 covers the current fall up to 1 August 2026. Its Max Drawdown is 52.97%, the same as the fall from the 6 October 2025 peak close to the 30 June 2026 close. A drawdown this deep is also where many traders give up on a plan; drawdown or broken strategy covers how to tell the difference.
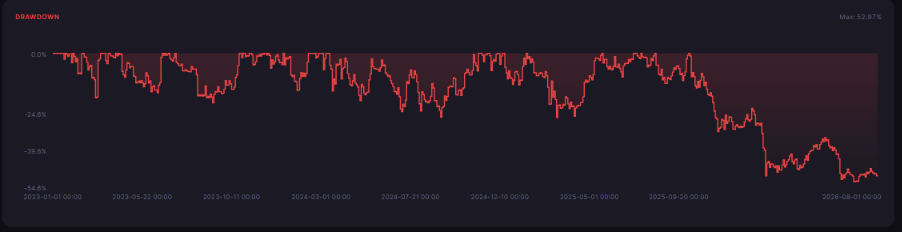
Drawdown of BTC Buy and Hold 1D 2023-2026 on CoinQuant, January 2023 to August 2026, with the card's Max: 52.97%.
Why Three Cycles Cannot Forecast the Fourth
Three falls are three data points. Who holds Bitcoin, how it is traded and how large the market is changed between each cycle, so the next fall has no reason to copy the last two.
A day count describes the past. It is not a countdown. For what one long backtest can and cannot say about the cycle, see whether you can trade Bitcoin's cycle. For rules tested in falling markets, see what actually backtests well when Bitcoin falls.
The two backtests above share the usual limits: fees included (0.1% taker fee on entry and exit); no slippage modelled; long only, one position at a time, no leverage; past results do not predict future results.
Common mistakes when sizing up a bear market
- Measuring from the day's high: say which reference you use; this article uses closes.
- Calling the lowest close so far the bottom: it is only the lowest so far.
- Reading a day count as a date: 364 and 378 days happened twice; that is not a rule.
The Practical Lesson
- Measure from a stated reference: peak close to lowest close, with dates.
- Track depth and days together: this cycle is shallower so far, and its lowest close is more than four months old.
- Plan for a long wait, not a date: the last two cycles took 847 and 1,074 days to pass their old peak close.
If you hold Bitcoin or trade it, write down your reference and check it against new closes as they come. In CoinQuant, a simple hold backtest gives you the Max Drawdown for any coin and window in a few minutes.
Build trading strategies on real data. No coding required.
Frequently Asked Questions
How long does a Bitcoin bear market last?
Measured from peak close to lowest close on Binance daily candles, the last two took 364 days (2017 to 2018) and 378 days (2021 to 2022). This cycle's lowest close so far came 267 days after its 6 October 2025 peak.
How many days since the Bitcoin peak?
On 5 November 2026, day 395, Bitcoin closed at 76,088.01, 38.96% below the 6 October 2025 peak close of 124,658.54. Each new day adds one: 9 November 2026 was day 399.
Has Bitcoin bottomed?
Closes cannot tell you that in advance. The lowest close so far is 58,624.71 on 30 June 2026, and no daily close went below it through 5 November 2026. That is a fact about the past, not a forecast.
Measure a fall on your own coin and window.
Disclaimer:
Key Takeaway