Bear Market Crypto Strategy: What Actually Backtests Well When Bitcoin Falls
.png)
Most crypto traders have a plan for when Bitcoin rises. Few have a tested plan for when it falls.
The 2022 bear market erased roughly 77% of Bitcoin's value between January and November. Traders holding spot BTC watched $47,000 become approximately $16,000 in eleven months. The question is not whether that was painful. The question is whether any active bear market crypto trading strategy could have reduced the damage, and what the data actually shows.
This article tests one specific strategy on real historical data across the full 2022 drawdown and reports the unfiltered results, including the numbers that do not look flattering.
The Challenge of Trading When Bitcoin Falls
Bear markets break most strategies designed for rising markets. Momentum systems generate false breakouts on every dead-cat bounce. Trend-following approaches get cut up by violent counter-rallies inside a larger downtrend. Mean reversion setups that perform well in sideways conditions can become loss ladders when the primary direction is consistently down.
The standard advice is to go to stablecoins or short the market. Shorting requires margin, carries liquidation risk, and demands timing precision most traders do not have. Going to stablecoins is capital preservation, not active strategy. Neither gives you a systematic, backtested framework for navigating a falling market with defined rules and measurable outcomes.
The alternative is a rules-based long-only approach that only enters at confirmed oversold extremes, avoids chasing the trend, and exits before momentum reverses again. The RSI oversold bounce strategy attempts exactly this. The 2022 bear market is the right testing ground because it represents the most severe BTC drawdown in recent history.
The Strategy We Tested
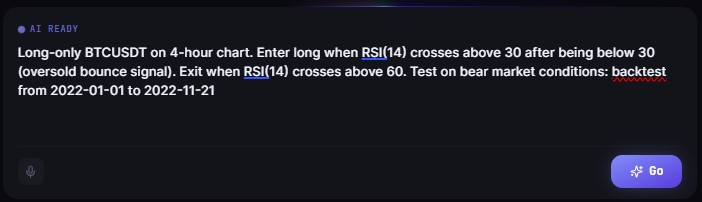
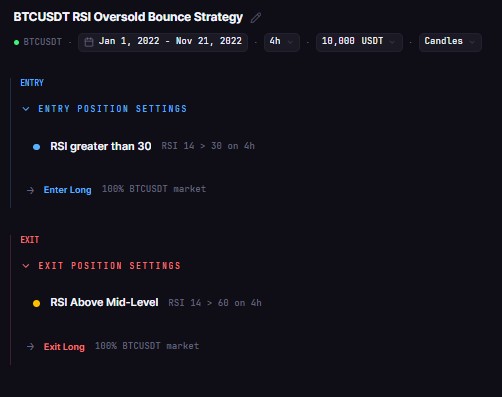
The strategy is a long-only RSI oversold bounce on BTCUSDT using the 4-hour chart.
The logic is straightforward:
Entry: Buy when RSI(14) crosses above 30 after dropping below 30. This targets potential short-term bounces off confirmed oversold conditions.
Exit: Sell when RSI(14) crosses above 60. This closes the position before the bounce exhausts itself and before bearish pressure resumes.
Position sizing: 100% of available capital per trade, one open position at a time.
The strategy does not short Bitcoin. It does not use leverage. Between signals, it holds cash. It is designed to capture defined bounce opportunities inside a falling market, take systematic exits, and stay flat during the worst of the downtrend.
This is not a strategy built to generate profits in a bear market. It is built to reduce losses compared to holding, while maintaining a positive win rate. The test shows how well it achieves that.
Backtest Configuration
The backtest was run on CoinQuant using Kaiko institutional data sourced from Binance via CoinQuant. Settings match CoinQuant's default configuration: 0.1% taker fee only, zero slippage, $10,000 starting capital. No coding required. The strategy was created using CoinQuant's natural language builder and backtested with one click.
The 2022 date range was chosen specifically because it captures the full scope of the most severe BTC bear market in recent years: from the late-cycle highs near $47,000 through the post-FTX collapse lows around $16,000.
Backtest Results
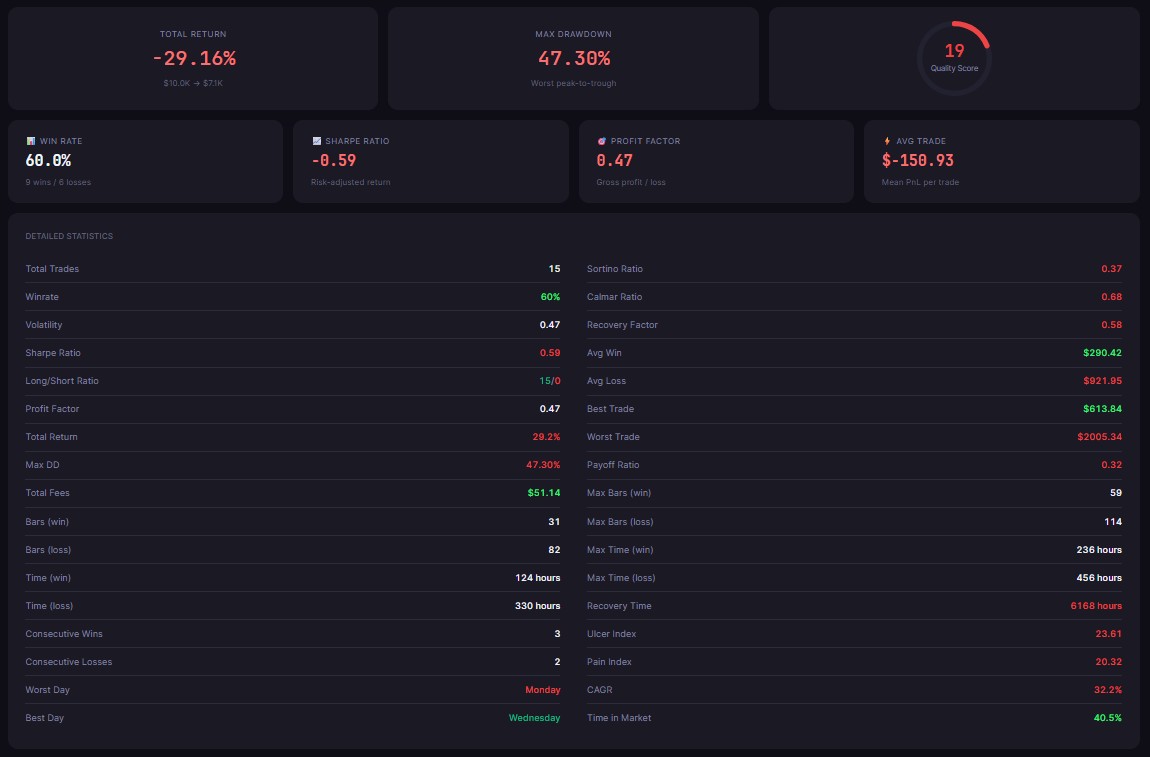
The backtest completed across all 11 months of the 2022 bear market. Results are below.
The -29.16% total return is a loss. That is the honest starting point. The strategy did not profit during the 2022 bear market.


The comparison with BTC spot is where the story changes. Bitcoin fell approximately 77% during this period. A trader holding BTC spot from January 1 to November 21, 2022 ended the period with roughly $2,300 on a $10,000 starting position. The RSI oversold bounce strategy, running on the same asset across the same dates, ended with approximately $7,100. That gap, roughly $4,800 on a $10,000 account, represents significant capital preservation even though both outcomes are negative.
The 60% win rate means nine of the 15 trades closed profitable. The strategy was right more often than wrong throughout one of Bitcoin's worst periods. Losing trades came from entries where the expected bounce failed to materialize, or reversed quickly after a brief pop.
The 15 total trades across 11 months reflects a low entry frequency. The strategy was in cash for the majority of the period, waiting for RSI to reach oversold conditions before entering. This is not a weakness. It is what kept the strategy from accumulating unnecessary losses during the sustained downtrend.
The 47.30% max drawdown is the most important risk metric to note. Even with a 60% win rate, open positions moved against the strategy before exiting on several occasions. This means the strategy's worst peak-to-trough paper loss during the period was nearly half the starting capital. Traders with low drawdown tolerance should factor this into any live deployment decision.
The -0.59 Sharpe Ratio reflects negative risk-adjusted returns, which is expected for a strategy operating inside a sustained bear market. A Sharpe below zero means losses exceeded what a risk-free return would have produced, adjusted for volatility. In a 2022 context where holding BTC produced approximately -77%, a Sharpe of -0.59 is consistent with a strategy that materially reduced loss exposure while keeping position volatility contained. The comparison is not between this strategy and cash - it is between this strategy and unmanaged exposure to the same asset across the same period.
The 0.47 Profit Factor - gross profit divided by gross loss - means the strategy generated $0.47 in gross profit for every $1.00 in gross losses. Any profit factor below 1.0 reflects net losses, which aligns directly with the -29.16% total return. With only 15 trades across 11 months, a small number of larger losing trades in the deepest phases of the drawdown have an outsized effect on this ratio. A higher-frequency strategy with more trade samples would produce a more statistically stable profit factor reading, but the low-frequency constraint here is intentional - the strategy only enters on confirmed oversold signals, not on volume.
What This Tells Us About Bear Market Trading
Three takeaways directly from the data:
Active management reduced drawdown materially. The difference between -77% (BTC spot) and -29.16% (this strategy) is not marginal. It is the difference between recovering from a 29% loss versus recovering from a 77% loss. A $10,000 account at -29% needs a 41% return to recover. The same account at -77% needs a 335% return to recover. The math of loss recovery makes capital preservation one of the most valuable outcomes of any bear market strategy.
Win rate does not eliminate drawdown risk. A 60% win rate is a strong result in any market environment. But the 47.30% max drawdown proves that win rate alone does not protect you from severe equity swings. Bear markets produce conditions where even winning strategies take sharp hits on losing trades. Understanding max drawdown before deploying capital is not optional.
Low frequency is selectivity, not passivity. 15 trades across 11 months means the strategy passed on entries most of the time. That is by design. Forcing entries in a bear market because you feel the need to be active produces more losing trades, more fees, and more emotional noise. A strategy that only fires on confirmed oversold signals limits unnecessary exposure during the worst phases of the downtrend.
The key constraint of this approach is its long-only design. It cannot capture gains from Bitcoin's sustained downward move. If you want to profit from a falling market, a long-only strategy is not the right tool. What it does do is reduce the cost of staying engaged with the market during a drawdown, with a defined ruleset and measurable outcomes.
How to Run This on CoinQuant
This backtest was built and run in under two minutes using CoinQuant's no-code AI trading platform. No Python, no Pine Script, no coding required.
The process:
Open CoinQuant and describe the strategy in plain English: "Long BTCUSDT on 4H. Buy when RSI(14) crosses above 30. Sell when RSI(14) crosses above 60."
CoinQuant's AI parses the strategy and builds the entry and exit conditions automatically.
Set the backtest parameters: date range, fees, and starting capital.
Run the backtest and review the full results, including total return, win rate, max drawdown, Sharpe Ratio, Profit Factor, and trade-by-trade detail.
The data powering the backtest is Kaiko institutional data sourced from Binance via CoinQuant, the same data provider used by institutional trading desks. Results reflect 0.1% taker fees on every trade, making them directly comparable to real trading costs on Binance.
You can modify the RSI thresholds, switch the timeframe, add a second indicator as a confirmation filter, or test the same logic on ETH instead of BTC. Every variation reruns in seconds, with no code to touch.
Disclaimer:
This content is for educational and informational purposes only and does not constitute financial, investment, or trading advice. All strategies and examples are for illustrative purposes and do not guarantee results. Always conduct your own research before making financial decisions.
Key Takeaway