
Crypto Exit Strategy: How to Plan When You Sell, and How to Test the Rule First

A crypto exit strategy is a plan, written before you buy, that says when and how you will sell. It can be a price target, a stop or an indicator signal, but it must be specific enough to follow without deciding in the moment. On CoinQuant, an AI trading platform, an exit is one line of a strategy that you describe in plain English and can backtest before you trust it.
That is the real difference between a written exit and selling by hand: a written rule can be tested on past prices, and a gut call cannot. Many holders ask when to sell crypto only after a big move. A written bitcoin exit strategy, or one for any coin, answers that question in advance.
This guide covers the three kinds of exit plan and what each needs before it can be tested. It then works through one example: the exit rule of BNB RVI 14 Midline 1D 2021-2026, with its best and worst trades. The author ran the backtest on CoinQuant.
Why a Crypto Exit Strategy Matters as Much as the Entry
The entry decides when you take risk. The exit decides what you keep. A good entry with no exit plan can give back a whole gain, and a late exit can turn a small loss into a large one.
Holders need an exit as much as traders do. Selling part at a target, selling everything below a level or selling when a trend signal turns are all exits, and each can be written down in advance.
The worked example shows the stakes. The same rule's best trade made $2,975.44 and its worst lost $1,624.91, and the same written exit closed both.
Three Kinds of Exit Plan
An exit strategy crypto traders use usually falls into one of three families.
- Price targets (ladders): sell at set prices or set gains, often in parts. Easy to follow, but the levels are guesses until they are tested.
- Stops: sell when price falls a set amount from entry or from a high. For the stop family in depth, see stop loss strategies compared and stop loss vs take profit on XRP.
- Indicator exits: sell when a signal turns, such as an oscillator crossing a level.
| Kind | Where it helps | Where it fails |
|---|---|---|
| Price target | Locks in gains at levels set in advance | Can sell early and miss the rest of a strong move |
| Stop | Caps the loss on any one trade | Can close a trade on a short dip that reverses |
| Indicator exit | Can stay in a trend while the signal holds | Reacts after the turn, so part of the move is given back |
What Each Kind Needs to Be Tested
An exit can be backtested only if it is specific. "Sell when it looks expensive" cannot be tested; "sell when RVI(14) crosses below 50" can.
| Kind | What it needs | What to read in the result |
|---|---|---|
| Price target | A price level or a gain from entry | How often the target was hit, and what came after |
| Stop | A price level or a loss limit, fixed or trailing | How many trades it closed, and the worst loss |
| Indicator exit | An indicator, its setting, a level and a direction | Where the exit rows fell in the trade log |
Every kind needs fees counted. Each exit is a sale and each sale pays a fee: the worked example paid $2,616.78 in fees over 207 trades.
Worked Example: One Indicator Exit
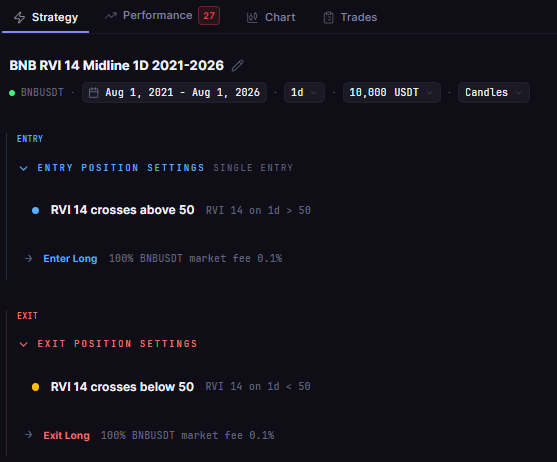
BNB RVI 14 Midline 1D 2021-2026 trades BNBUSDT on daily candles (Binance spot, Kaiko via CoinQuant) from 1 August 2021 to 1 August 2026, with $10,000, 100% of equity and a 0.1% fee on entry and exit. Its rules, as stored:
- Entry: buy when the Relative Volatility Index (period 14) crosses above 50.
- Exit: sell when RVI(14) crosses below 50.
The Relative Volatility Index scores from 0 to 100 whether volatility over its lookback comes more from up closes or down closes; 50 is the midline. All 207 exits in the test came from this exit rule. On the Strategy tab, the exit is its own line, listed under the entry.
| Metric | RVI 14 rule on BNB |
|---|---|
| Strategy | BNB RVI 14 Midline 1D 2021-2026 |
| Total Return | -33.84% |
| Final Balance | $6,616.04 |
| Total Trades | 207 |
| Win Rate | 22.71% (47W / 160L) |
| Profit Factor | 0.86 |
| Average Win / Average Loss | $432.57 / $148.22 |
| Max Drawdown | 59.44% |
| Total Fees | $2,616.78 |
Over five years the rule lost money while BNB rose: the platform's Buy and Hold figure saved with the run, which carries no fees, is 72.92%. The exit is clear and testable; that does not make it profitable.
The Best and Worst Trades
| Trade | Entry (UTC) | Exit (UTC) | Order rows | Net PnL |
|---|---|---|---|---|
| Best trade | 19 February 2024 | 17 March 2024 | 233 and 234 | $2,975.44 |
| Worst trade | 25 October 2025 | 4 November 2025 | 359 and 360 | -$1,624.91 |
The same rule closed both trades. In the best one, the fill price rose from $351.60 at entry to $571.70 at the exit, filled on the day RVI(14) crossed below 50. In the worst, the fill price fell 16.12% from entry to exit before the signal turned.
An indicator exit waits for its condition, so it can stay in a strong move and it can also sit through a fall. The Trades tab shows the 2024 trade's two order rows.

How to Write Your Own Exit and Test It
Here is the worked example in plain English, as you would type it into CoinQuant:
Buy BNBUSDT on the daily chart when the Relative Volatility Index (period 14) crosses above 50. Sell when it crosses below 50. Test from August 1, 2021 to August 1, 2026 with $10,000, 100% of equity per trade and a 0.1% fee.
Then follow the same steps for your own exit:
- Write the exit first: decide what makes you sell before you decide what makes you buy.
- Make it specific: name the indicator, its setting, the level and the direction, or the price level.
- Read the stored rule: on the Strategy tab, check that the exit line says what you meant.
- Run it with fees: read Total Return, Max Drawdown and the Average Win against the Average Loss.
- Check the exit rows: on the Trades tab, see where the exits fired on the best and worst trades.
- Compare with holding: a tested exit should beat holding the same coin over the same window; this one did not.
No coding required. For a trend exit on Ether, see the golden cross backtest on Ethereum, which sells on the death cross.
Common Mistakes When Planning an Exit
- Deciding in the moment: an exit that is not written down bends to fear and greed.
- Testing without fees: every exit is a sale that pays a fee.
- Judging by one trade: the same exit made $2,975.44 once and lost $1,624.91 another time.
- Skipping the benchmark: this rule lost 33.84% while BNB rose over the same five years.
- Ignoring the worst stretch: the rule's Max Drawdown reached 59.44%; see Maximum Drawdown in crypto trading for how to read it.
Limits
- Costs: fees included, no slippage modelled.
- No guarantee: a tested exit shows how a rule handled past prices, not future ones.
- One example: one coin, one window and one setting.
- Not advice: this is not tax or financial advice, and selling can have tax effects that a backtest ignores.
The Practical Lesson
- Decide the exit before the entry: write it down while you are calm.
- Make it testable: a level, or an indicator with a setting and a direction.
- Check both ends: read how the exit closed the best trade ($2,975.44) and the worst (-$1,624.91), with fees included.
A crypto exit strategy is only as good as its record on past prices. Write the rule, test it in CoinQuant and compare it with holding before you rely on it.
Build trading strategies on real data. No coding required.
Frequently Asked Questions
What is a good crypto exit strategy?
One that is written before you buy, specific enough to test and checked against past prices with fees included. Whether it is a target, a stop or an indicator signal matters less than how it held up in a backtest.
When should I sell crypto?
When your written exit rule says so, not when a headline or a price swing pushes you. Decide the rule in advance, test it, then follow it.
Can I test an exit before using it?
Yes, if it is specific. Write it as a rule, backtest it with fees included and read where it closed past trades. BNB RVI 14 Midline 1D 2021-2026 shows both sides: a best trade of $2,975.44 and a worst of -$1,624.91.
Write your exit as a rule, then see how it would have closed past trades.
Disclaimer:
Key Takeaway