
Bitcoin Seasonality: What Nine Years of Monthly Candles Say About Uptober and November

Bitcoin seasonality is the idea that some months of the year tend to be better or worse for Bitcoin than others. The best known example is "Uptober", the belief that October is usually a strong month. To test the idea on real data, we counted every closed monthly candle on Binance from August 2017 to October 2026, and the author checked the holding record on CoinQuant, an AI trading platform.
The short answer: seven of ten Octobers closed up, but October 2025 and October 2026 both closed down. Novembers were split, with four up and five down. The typical November (the median) fell 7.10%.
This guide explains how the numbers were measured, why the average and the typical month disagree, and how to turn a seasonal hunch into a rule you can test.
What "Uptober" Means
"Uptober" is trader slang for a strong October. It caught on because several Octobers in Bitcoin's history closed with big gains, and the name made the pattern easy to repeat.
November gets attention for the opposite reason. A few deep red Novembers stuck in traders' memories, so the question that follows a weak October is whether November will be weak too. The only honest way to answer is to count the months with one method and then ask whether the count is big enough to act on.
How We Measured Bitcoin Seasonality
Small changes in method can move monthly figures, so here is exactly what was counted:
- One venue and pair: Binance BTCUSDT spot.
- Monthly candles in UTC: each month runs from its first to its last day, UTC.
- Closed months only: the first month in the data is August 2017 and the last closed month is October 2026. November 2026 had not closed when the data was taken on 3 November 2026, so it is left out.
- Open to close: each month's return is its close against its own open. Measuring close to close (the prior month's close to the month's own close) gives the same up and down counts.
Other exchanges report slightly different prices, so their monthly figures can differ a little. The counts of up and down months are what matter here.
October and November by the Numbers
Here is the year by year record for the two months, a simple Bitcoin seasonality chart by month for October and November.
| Year | October | November |
|---|---|---|
| 2017 | 47.61% | 52.24% |
| 2018 | -3.84% | -36.55% |
| 2019 | 10.26% | -17.49% |
| 2020 | 27.97% | 42.82% |
| 2021 | 39.89% | -7.10% |
| 2022 | 5.50% | -16.24% |
| 2023 | 28.47% | 8.90% |
| 2024 | 11.00% | 37.15% |
| 2025 | -3.89% | -17.56% |
| 2026 | -7.22% | Not closed, excluded |
And the summary for each month:
| Month | Closed months | Up | Down | Mean | Median | Best | Worst |
|---|---|---|---|---|---|---|---|
| October | 10 (2017 to 2026) | 7 | 3 | 15.57% | 10.63% | 47.61% (2017) | -7.22% (2026) |
| November | 9 (2017 to 2025) | 4 | 5 | 5.13% | -7.10% | 52.24% (2017) | -36.55% (2018) |
October 2026 was the weakest October in the data, and it followed a red October in 2025. Measured close to close, the 2018 November loss is 36.58% instead of 36.55%; the up and down counts do not change.
Why the Mean and the Median Disagree
The mean adds every month and divides by the count. The median is the middle month once they are sorted, so it shows the typical result.
For November the two point in opposite directions. The mean is 5.13%, which sounds positive. The median is -7.10%, which says the typical November lost money. The gap comes from two huge Novembers, 2017 (52.24%) and 2020 (42.82%): take those two out and the average of the other seven turns negative.
The same idea applies to backtests, where one big trade can lift an average. For more, see average trade vs median trade.
What a Month Count Cannot Tell You
Ten Octobers and nine Novembers are a small sample. A count that small can shift with each new year, as the two red Octobers in a row show, and it says nothing about why a month was strong or weak.
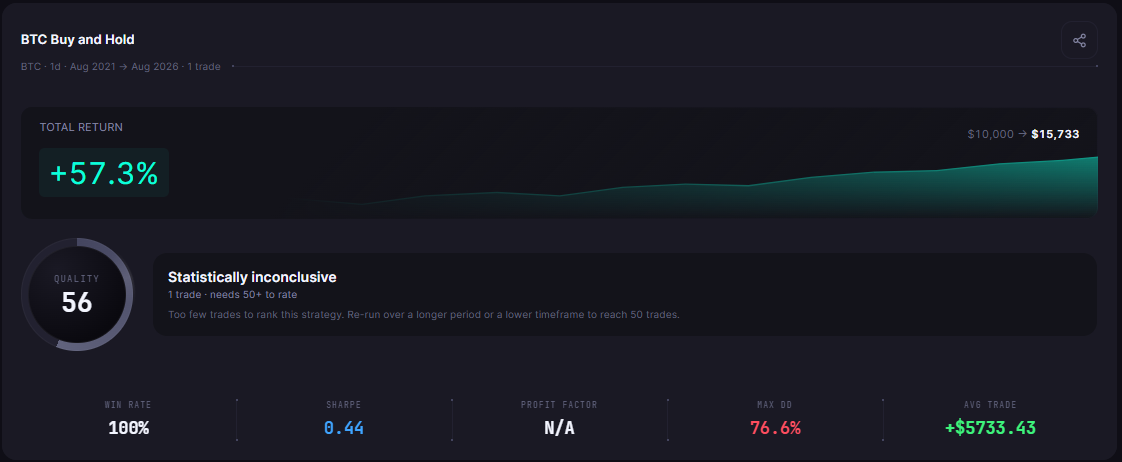
A backtest of simply holding shows something a month count hides: the whole path a holder sat through. BTC Buy and Hold 1D 2021-2026 bought Bitcoin on 1 August 2021 and held it to 1 August 2026. It returned 57.33%, fees included, but on the way it fell 76.63% from its peak on 8 November 2021 to its low on 21 November 2022. Both ends of that fall landed in a November.
On the Performance tab, the results card shows QUALITY 56 next to "Statistically inconclusive" (1 trade · needs 50+ to rate). No month filter was tested in this article.
How to Test a Seasonal Idea Step by Step
- Rule first: write the idea as a rule. "Hold Bitcoin only in October" is a rule; "October is usually good" is not.
- Baseline: test plain holding first, so the seasonal version has something to beat.
- Stored rule: check that the platform saved exactly what you meant, with no extra conditions.
- Same window and fee: compare the two runs, then judge the median result and the worst fall, not only the average.
The baseline used here is written in plain words, the way you would type it into CoinQuant:
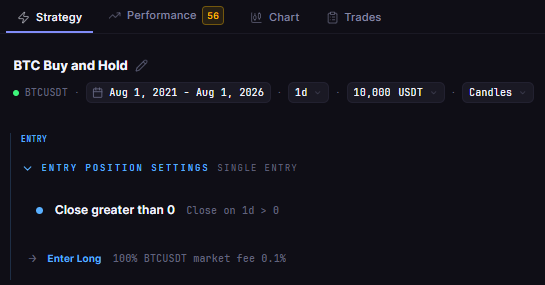
Buy BTCUSDT on the daily chart when the close is greater than 0, using 100% of equity and a 0.1% fee, and hold to the end of the test. Test from August 1, 2021 to August 1, 2026 with $10,000.
Its Strategy tab shows that single entry rule and no exit rule, so it holds through every month.
Limits
- Small samples: ten Octobers and nine Novembers; one more year can change the picture.
- History only: past months do not predict any future month.
- One venue: Binance monthly candles; other exchanges differ slightly.
- Backtest costs: the holding record includes fees at 0.1% on entry and exit; no slippage modelled.
Common Mistakes
- Trusting the mean alone: November's positive mean hides a negative median.
- Counting open months: a month that has not closed can still change; leave it out.
- Mixing methods: open to close and close to close can differ slightly, so pick one and say which.
- Skipping the test: a seasonal story is not a strategy until it is written as a rule and backtested.
For a longer cycle view, see whether you can trade Bitcoin's four year cycle, and for why the worst fall matters, how to read Max Drawdown.
The Practical Lesson
- A month's history is a story, not a rule: seven up Octobers in ten did not stop 2025 and 2026 from closing down.
- Read the median: the typical November lost 7.10% even though the mean was positive.
- Test before you trade it: write the seasonal idea as a rule and compare it with plain holding on the same window.
In CoinQuant you describe a rule in plain words, read the stored rule on the Strategy tab and backtest it against a buy and hold baseline.
Build trading strategies on real data. No coding required.
Frequently Asked Questions
Is Uptober real?
Partly. On Binance monthly candles, seven of ten Octobers from 2017 to 2026 closed up, with a median gain of 10.63%, but October 2025 and October 2026 both closed down.
Is November usually red for Bitcoin?
Slightly more often than not. Four of nine closed Novembers from 2017 to 2025 were up and five were down, and the median November fell 7.10%.
Can I trade Bitcoin seasonality?
Only after you test it. Ten or fewer years per month is a small sample, so write the idea as a rule and backtest it against holding before risking money.
Turn your seasonal idea into a written rule and see how it compares with holding.
Disclaimer:
Key Takeaway