
Best Timeframe for Crypto Trading Strategies: 1-Minute to 1-Month Backtested
Which timeframe should you trade? The answer is usually given as opinion: scalpers say 1-minute, swing traders say daily, and nobody shows data. This article shows data. The same strategy, an RSI(14) mean reversion rule, was backtested across six timeframes on Bitcoin and three on Ethereum, and the results are unambiguous.
The rule is identical everywhere: buy when RSI(14) crosses below 30, sell when RSI(14) crosses above 50, 100% position, long only, no leverage, with Binance standard taker fees (0.1%) included in every run. The only variable is the timeframe. All nine strategies are named entries in the CoinQuant Strategy Library, so every result is reproducible.
Best Timeframe for Crypto Trading: The Bitcoin Results
| Timeframe | Strategy (library name) | Total Return | Trades | Win Rate | Profit Factor | Sharpe | Max DD | Fees Paid |
|---|---|---|---|---|---|---|---|---|
| 5m | BTC RSI(14) Mean Reversion 5m | -38.3% | 235 | 42.6% | 0.32 | -9.32 | 38.7% | $3,831 |
| 15m | BTC RSI(14) Mean Reversion 15m | -31.4% | 138 | 51.4% | 0.51 | -2.32 | 32.3% | $2,285 |
| 1h | BTC RSI(14) Mean Reversion 1h | -33.0% | 72 | 51.4% | 0.52 | -1.47 | 42.4% | $1,141 |
| 4h | BTC RSI(14) Mean Reversion 4h | -9.3% | 33 | 69.7% | 0.87 | -0.06 | 31.5% | $703 |
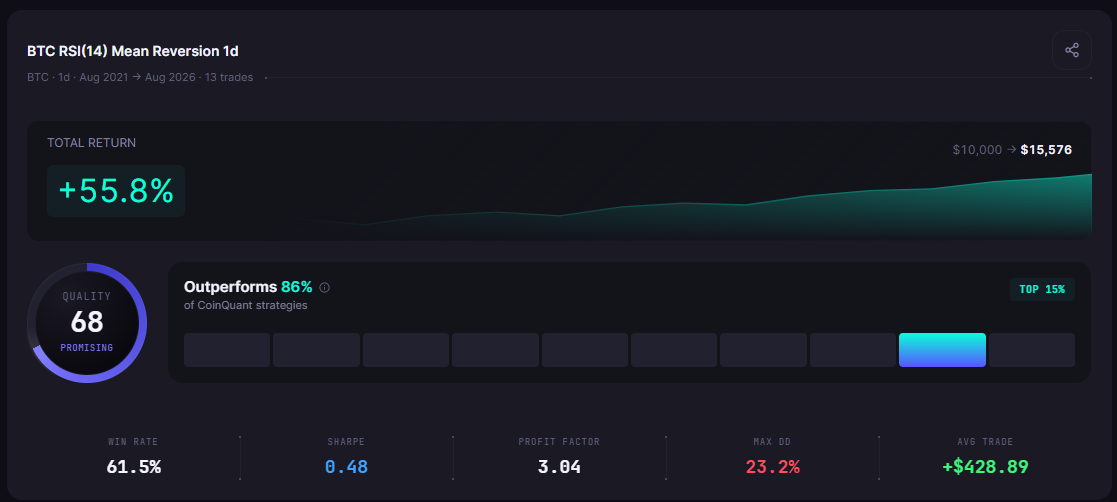
| 1d | BTC RSI(14) Mean Reversion 1d | +55.8% | 13 | 61.5% | 3.04 | 0.48 | 23.2% | $364 |
| 1w | BTC RSI(14) Mean Reversion 1w | -10.6% | 1 | 0.0% | 0.00 | -0.13 | 26.3% | $19 |
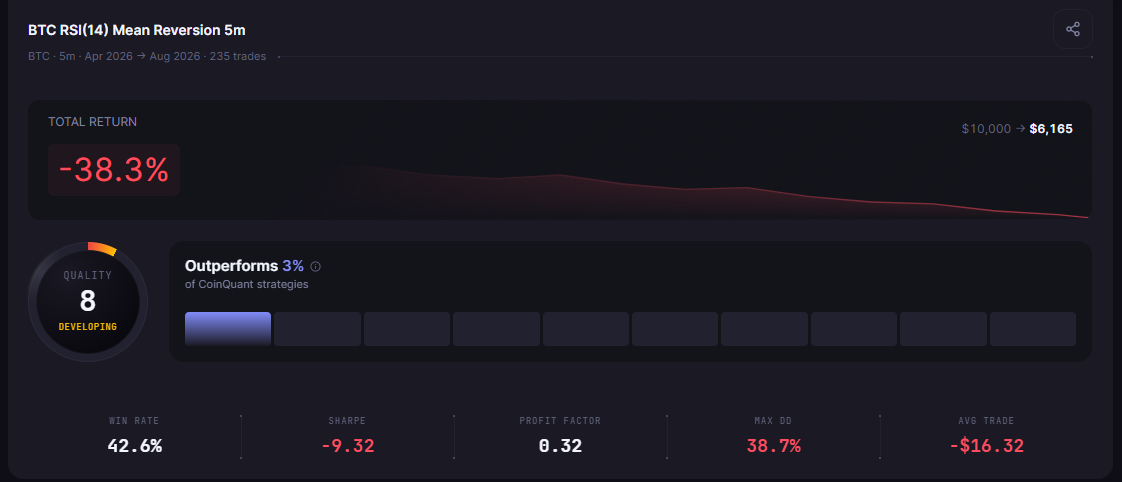
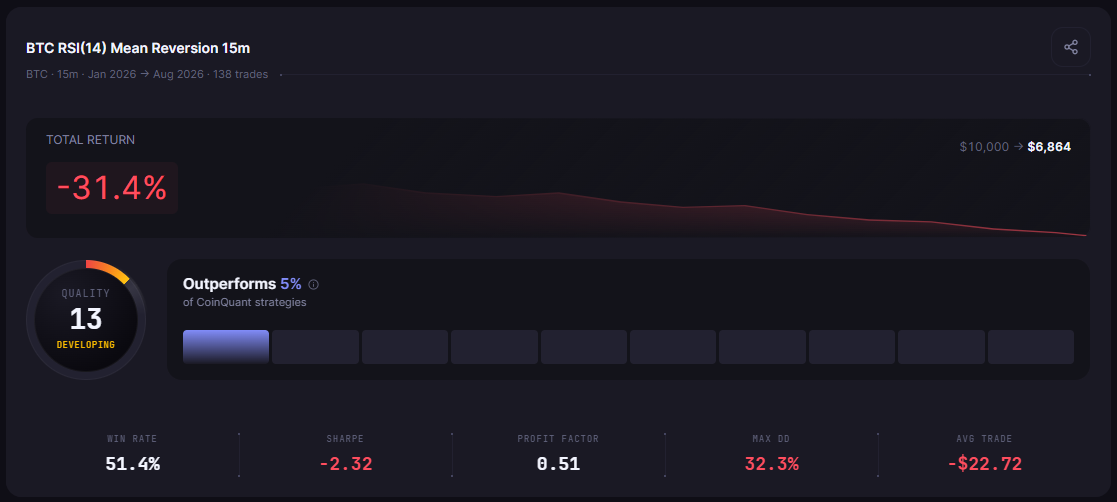
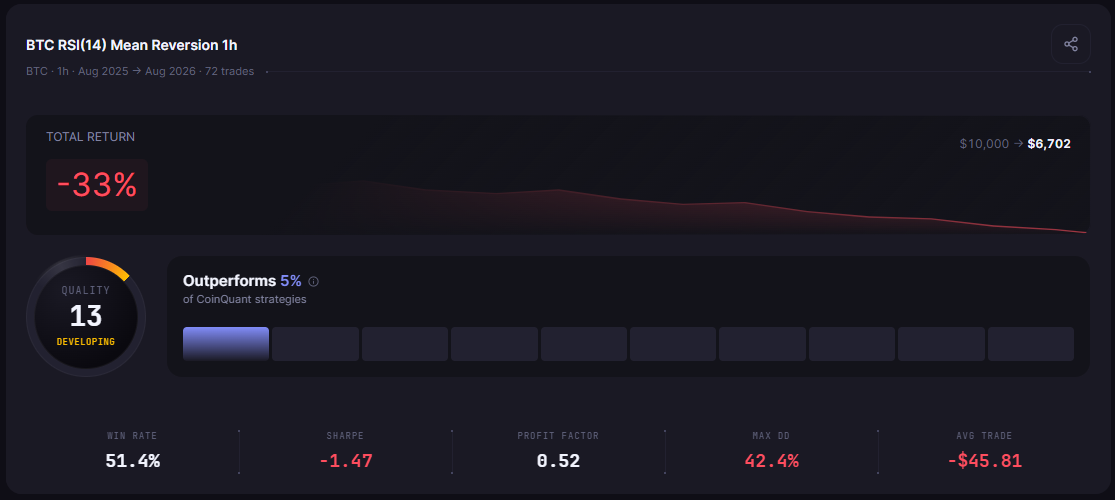
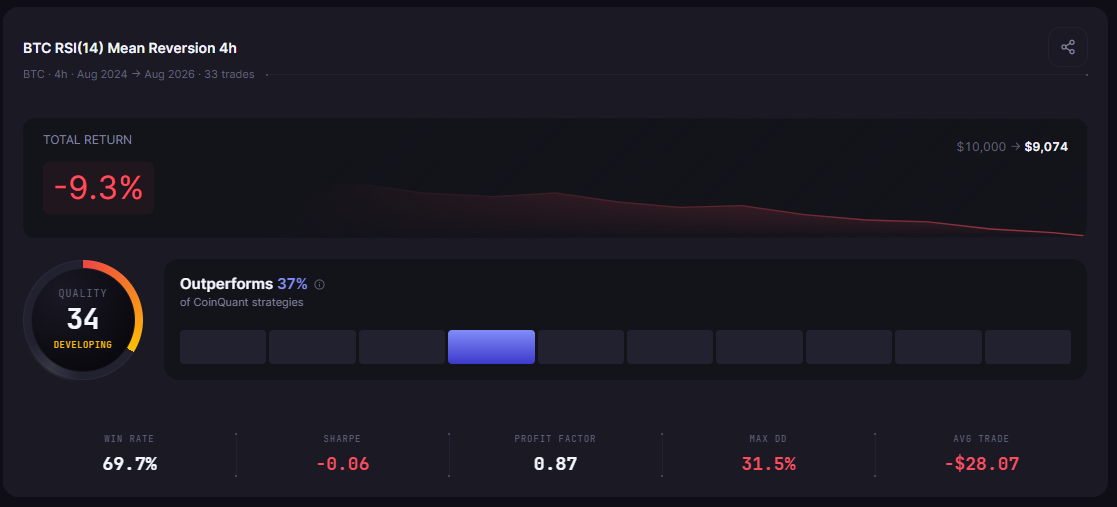
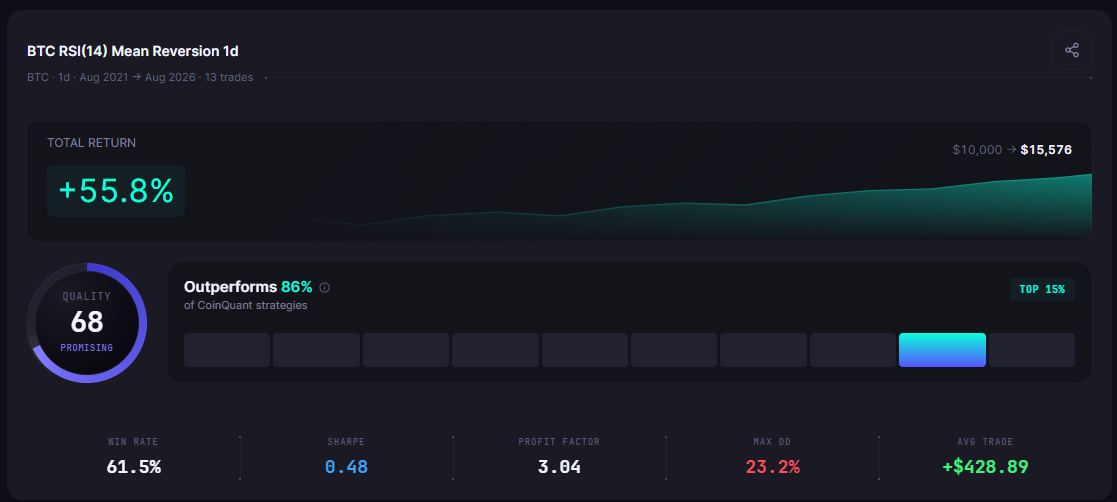
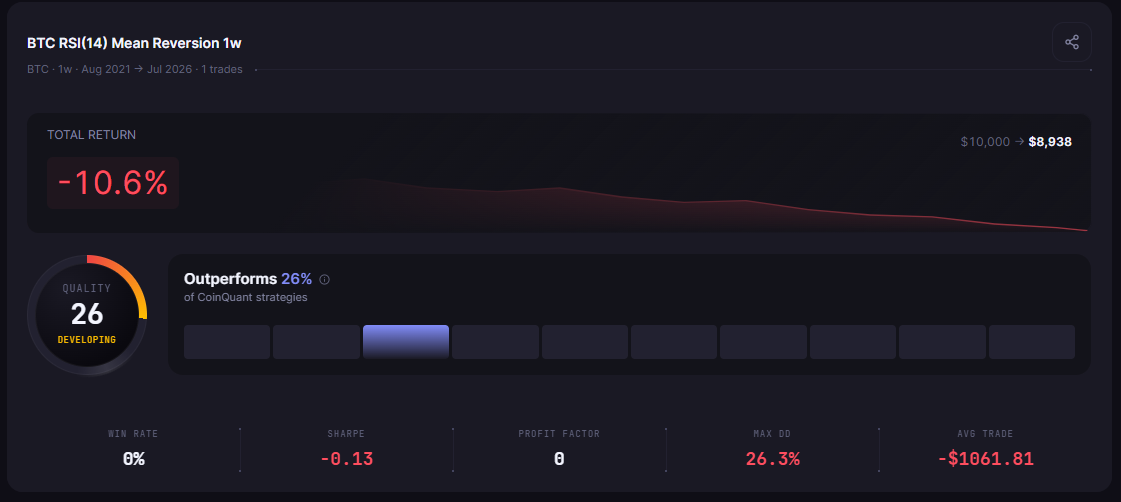
The pattern is a straight line: the daily timeframe is the only one that made money, and the lower the timeframe, the worse the result. The 5-minute version lost 38.3% of its capital in four months.
Why Daily Wins: The Fee Story
The most important column in the table is the last one. Fees paid: $3,831 on the 5-minute run, $2,285 on 15-minute, $1,141 on 1-hour, $703 on 4-hour, $364 on daily. The 5-minute strategy spent 38% of its starting capital on fees alone, and every one of those 235 trades also paid the spread.
The math is brutal and simple. At 0.1% per side, each round trip costs 0.2%. A strategy that trades 60 times a month is paying 12% of its account in fees every month, before a single losing trade. The RSI rule's raw edge on lower timeframes is real in theory and negative in practice, because the edge is smaller than the cost of expressing it.
This is the answer to "should I trade 5-minute or 15-minute?" for most retail traders: not until the edge per trade is large enough to survive the fee structure, and the backtest is the only way to check that before going live.
Why Daily Wins: The Signal Quality Story
Fees explain part of the gap. Signal quality explains the rest.
On the daily chart, an RSI(14) reading below 30 is a rare event that reflects a real multi-day capitulation, and the strategy's 61.5% win rate with a profit factor of 3.04 shows those signals resolved in favor of the buyer. On the 5-minute chart, RSI crosses below 30 constantly, in both directions of the market, and the strategy churned through 235 trades of noise.
The multi-timeframe RSI study reached the same conclusion from the opposite direction: when traders combine a fast entry timeframe with a slow filter timeframe, the slow filter is what carries the edge. The data above shows why: the signal quality lives on the higher timeframe.
The Ethereum Check: Same Conclusion
The same rule on Ethereum confirms the pattern:
| Timeframe | Strategy (library name) | Total Return | Trades | Profit Factor | Sharpe | Max DD |
|---|---|---|---|---|---|---|
| 1h | ETH RSI(14) Mean Reversion 1h | -27.9% | 71 | 0.70 | -0.79 | 35.5% |
| 4h | ETH RSI(14) Mean Reversion 4h | -33.1% | 33 | 0.63 | -0.31 | 41.9% |
| 1d | ETH RSI(14) Mean Reversion 1d | -57.2% | 10 | 0.25 | -0.28 | 63.8% |
Ethereum is the mirror image: the daily rule lost the most, because buying ETH on daily oversold readings between 2021 and 2026 meant catching a falling asset, the same dynamic the Bitcoin five-approach study documents from the opposite side on trend versus mean reversion. The cross-asset conclusion stands: timeframe choice interacts with asset behavior, and neither is a detail.
The Verdict: What the Data Says
The backtest answers the question with numbers, not opinion:
Daily is the best timeframe for this strategy on Bitcoin: +55.8% return, 3.04 profit factor, the lowest drawdown of the six, and the lowest fee bill
Lower timeframes lose for two reasons: fees consume the edge, and signals drown in noise
Weekly is too slow for mean reversion: one trade in five years is not a strategy
The asset matters as much as the timeframe: the same daily rule that won on BTC lost on ETH
The general principle behind the results: the best timeframe for a crypto strategy is the slowest one where the signal still fires often enough to matter. For mean reversion on Bitcoin, that is daily. For trend strategies, the equivalent test on the same ladder usually lands at 4H to daily, and the way to find out for your own rules is the same way these numbers were produced: run the identical strategy across timeframes and read the full metrics.
One more pattern in the data is worth naming: the win rate climbs as the timeframe climbs. The 5-minute run won 42.6% of trades, the 4-hour run won 69.7%, and the daily run won 61.5% while earning the highest profit factor of the set. Lower timeframes do not just cost more in fees, they generate lower-quality signals, because RSI extremes on short candles reflect microstructure noise rather than genuine capitulation. That double penalty, worse signals and higher costs, is why the ranking is not close.
How to Run This Comparison Yourself
The comparison is deliberately simple to reproduce on CoinQuant:
Build the strategy once in plain English (RSI(14) below 30 entry, above 50 exit)
Clone it across timeframes: 5m, 15m, 1h, 4h, 1d, 1w
Run each with fees included and the same window discipline
Compare total return, profit factor, and fees paid
The nine strategies in this article are already in the library under their exact names, so the comparison can also be opened directly. The best RSI settings study and the 15-minute scalping backtest show what happens when the lower-timeframe question is taken seriously on its own terms.
The Bottom Line
The best timeframe for crypto trading is not a preference, it is a measurement. On the same rules, same data, and same fees, the daily timeframe returned +55.8% while the 5-minute timeframe lost 38.3%, and the fee column explains most of the gap. Before choosing a timeframe for any strategy, run the ladder, read the fees, and let the data pick.
Disclaimer:
Key Takeaway
