
Best RSI Settings for Day Trading Crypto (5-Min & 15-Min, Backtested)

The RSI is one of the most-searched indicators for crypto day trading. Type "best RSI settings for day trading crypto" into any search engine and you will find dozens of articles recommending RSI 14 with 30 and 70 as the standard oversold and overbought levels.
The advice is consistent. The evidence is usually missing.
This article does something those articles skip: it backtests RSI 14 with 30/70 entries and exits on the 15-minute Bitcoin chart across two full years of intraday data, from July 2024 to July 2026, and reports every number without adjustment. The result reveals why default RSI settings and short timeframes are a difficult combination, even when the win rate looks healthy.
What the RSI Day Trading Strategy Actually Does
The Relative Strength Index measures the speed and magnitude of recent price changes. It oscillates between 0 and 100. Readings below 30 signal that an asset may be oversold; readings above 70 signal that it may be overbought.
The classic day trading interpretation:
Entry: wait for RSI to fall below 30 (oversold), then buy when it crosses back above 30
Exit: sell when RSI crosses above 70 (overbought)
This is the standard textbook setup. The rules are:
Indicator: RSI, 14-period
Oversold threshold: 30 (entry trigger on the cross back above)
Overbought threshold: 70 (exit trigger on the cross above)
Direction: long only, no leverage
Position size: 100% of equity per trade
Fees: applied to every entry and exit (standard exchange rate)
The logic is straightforward: buy when the market has pulled back sharply and appears due for a bounce, exit when momentum has recovered into overbought territory. On paper, it captures mean reversion on short-timeframe moves.
Test Setup
The backtest ran on CoinQuant using a single strategy on a single instrument. No filters, no additional conditions. The result reflects the RSI logic alone.
| Parameter | Setting |
|---|---|
| Instrument | BTCUSDT (spot) |
| Timeframe | 15-minute (15M) |
| Period | Jul 2024 to Jul 2026 |
| Indicator | RSI (14-period) |
| Entry | RSI crosses above 30 from below |
| Exit | RSI crosses above 70 |
| Direction | Long only, no leverage |
| Initial capital | $10,000 |
| Position size | 100% of equity per entry |
A note on the title: it references both 5-minute and 15-minute timeframes. The backtested data shown here is the 15-minute test, which is the shortest timeframe where we have two full years of verified intraday history for BTCUSDT. The 5-minute case is discussed conceptually below. The core problem, fee drag from high trade frequency, only gets worse as the timeframe shrinks.
The Backtest Results
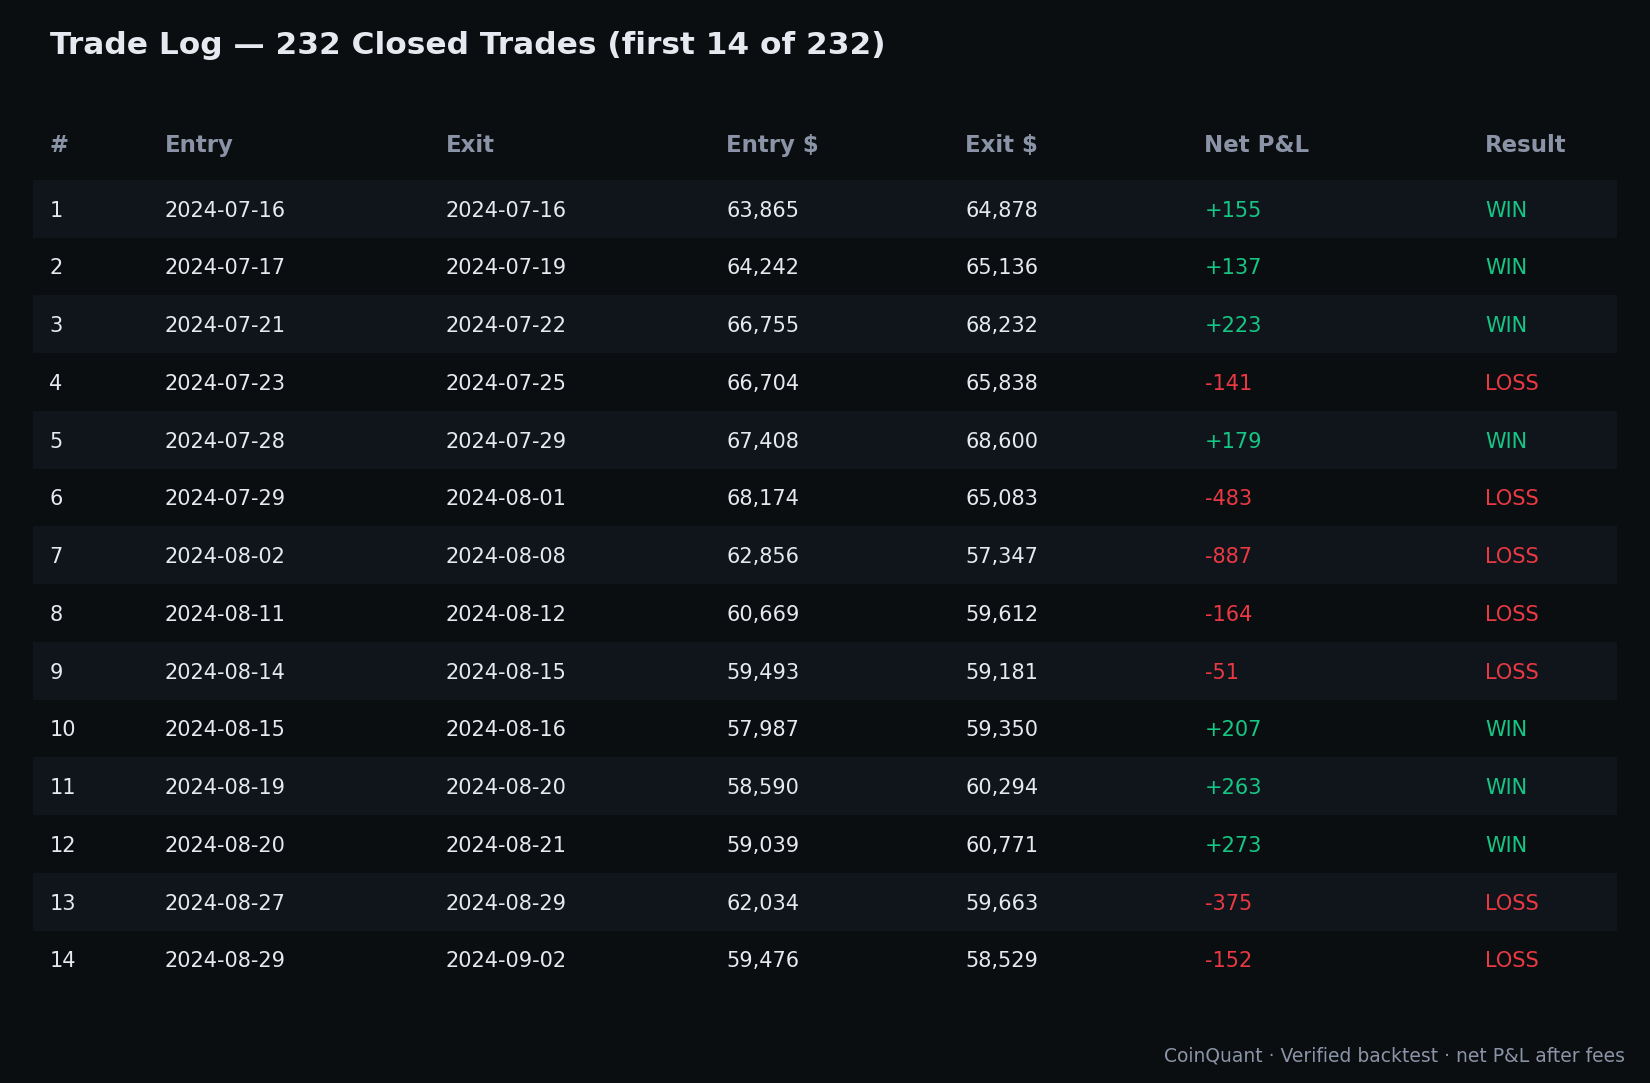
Over two years on the 15-minute chart, RSI 14 with 30/70 turned $10,000 into $10,433. That is a +4.33% total return across 232 trades, with a 63.36% win rate.
A win rate above 63% sounds encouraging. The full picture is not.
| Metric | Result |
|---|---|
| Total Return | +4.33% ($10,000 to $10,433) |
| CAGR | 2.14% |
| Total Trades | 232 |
| Win Rate | 63.36% |
| Profit Factor | 1.02 |
| Payoff Ratio | 0.59 |
| Sharpe Ratio | 0.23 |
| Sortino Ratio | 0.17 |
| Calmar Ratio | 0.06 |
| Max Drawdown | 33.63% |
| Average Win | $167 |
| Average Loss | $283 |
| Best Trade | +$465 |
| Worst Trade | -$2,800 |
| Time in Market | 49.56% |
| Total Fees | $995.44 |
| Quality Score | 38 / 100 |

What the Data Shows

The win rate is not the edge
A 63.36% win rate is genuinely above chance. In most strategies, that would be considered a meaningful edge. Here it produced a Profit Factor of 1.02, which means that for every $1.00 earned, the strategy lost $0.98. That is essentially break-even before adding the psychological cost of watching 232 trades open and close.
The reason is the payoff ratio. The average win was $167 and the average loss was $283. Losers were 1.7 times larger than winners. The best single trade returned $465. The worst single trade lost $2,800, larger than 16 average wins combined. A high win rate cannot compensate for that kind of asymmetry.
Fees ate the profit
The single most important line in this backtest is the fee total: $995.44.
The strategy started with $10,000 and gained $433 in net return. But it paid $995 in trading fees along the way. Without fees, the gross gain would have been roughly $1,428, a 14.28% return. Fees consumed roughly 70% of the gross profit.
This is the defining problem of short-timeframe day trading. With 232 trades over two years, fees compound relentlessly. A standard exchange fee of around 0.1% per side sounds trivial per trade. Across 232 round trips, it becomes a substantial drag that a marginal edge cannot overcome.
On the 5-minute chart the problem amplifies. A 5-minute RSI strategy on BTC would generate roughly three to five times as many trades over the same period. More trades means more fees, and the edge per trade on a shorter timeframe is typically smaller, not larger. The math works against day traders who use high-frequency RSI signals without accounting for transaction costs.
The drawdown is the other problem
A 33.63% max drawdown on a long-only RSI strategy with no leverage is notable. The strategy was in the market roughly half the time (49.56%), and in that half it still managed to drawdown a third of the account.
The Sharpe Ratio of 0.23 and Sortino of 0.17 are both well below 1.0, which is the threshold where a strategy begins to offer meaningful risk-adjusted return. The Calmar Ratio of 0.06 compares annual return to max drawdown: 2.14% of annual gain per 33.63% of max drawdown is a poor trade.
The Quality Score of 38 out of 100 reflects all of this. The strategy has a real win rate but the edge is too thin, the loss size too large, and the fee burden too heavy to be a reliable income source.
RSI Day Trading vs Simply Holding Bitcoin
The simplest alternative to any active strategy is holding Bitcoin.
| Approach | Trades | Time in Market | Total Return | Max Drawdown |
|---|---|---|---|---|
| RSI 14 (30/70), 15-min | 232 | 49.56% | +4.33% | 33.63% |
| Buy and hold Bitcoin | 0 | 100% | ~+10x (Jul 2024 to Jul 2026) | ~55% |
The buy-and-hold outcome over the same two-year window was substantially higher. The RSI strategy captured roughly 43% of the buy-and-hold result while doing 232 trades, paying nearly $1,000 in fees, and accepting a 33% drawdown. It was active half the time for a fraction of the passive return.
This comparison does not mean RSI day trading is always worse than holding. It means that the default settings, 14 periods with 30 and 70 thresholds, on a 15-minute chart, without filters or position sizing, did not justify the additional complexity and cost.
The Practical Lesson
This backtest is not a verdict on RSI as a tool. RSI is useful. It is a verdict on the assumption that default settings on a short timeframe produce reliable returns:
A 63% win rate is not enough when the average loss is nearly double the average win
Fees on 232 trades consumed most of the gross profit and left a near-break-even result
Shorter timeframes (5-minute) amplify the fee problem, not the edge
The Profit Factor of 1.02 signals a strategy that is structurally at break-even before slippage and psychological cost
What RSI settings work better? The answer is usually a combination of: fewer signals (wider thresholds like 20/80), longer timeframes (1-hour or daily), position sizing that limits exposure per trade, and a trend filter that prevents taking oversold signals in a downtrend
The right next step is testing those variations individually, one change per backtest, before trading with real capital. Each modification needs its own verified result.
That is the entire point of running a best RSI settings for day trading crypto test before going live: you discover that the win rate is not the number that matters most, fees and loss size are.
Backtest your own RSI settings and timeframes on CoinQuant. Test RSI day trading settings free on CoinQuant
Disclaimer:
Key Takeaway