
What Happens to Bitcoin When the Fed Raises Rates?
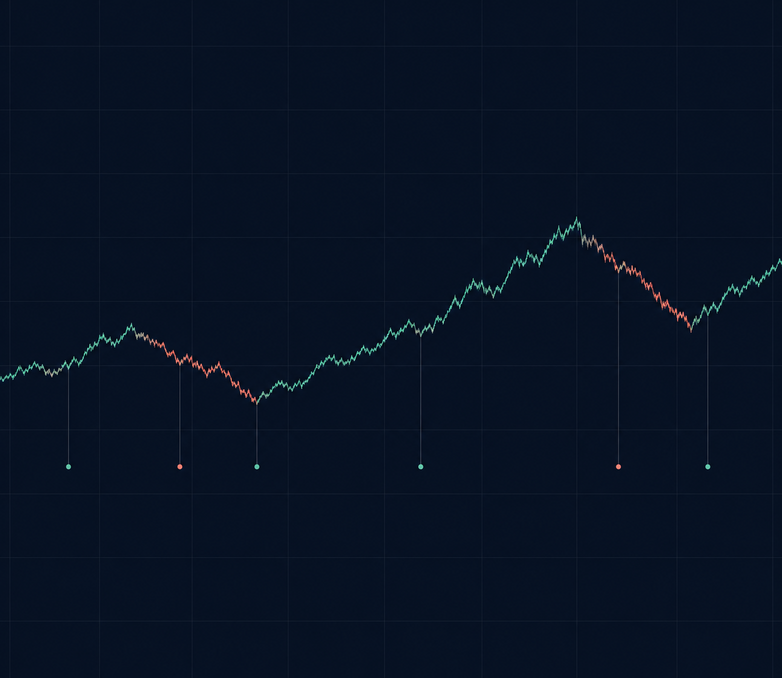
Not usually on the day itself: in CoinQuant's check of the 17 Fed hike days since Dec 2017, Bitcoin closed lower on only 6, and its average move (2.25%) was the same as on any day. The bigger moves often came the day after.
The search "what happens to bitcoin when fed raises rates" is usually a question about the day itself: does Bitcoin fall on the day of a hike? CoinQuant, an AI trading platform, checked every rate hike the Federal Reserve has made since December 2017 against all days in the same years.
This article sets out how a hike day was counted, lists all 17 days, compares them with ordinary days and with the day after, and shows what two backtests that trade daily closes went through in the hiking years.
Criteria First: What Counts as a Hike Day, and How We Measured It
A hike day is a Federal Open Market Committee (FOMC) statement day on which the Fed raised its target range for the federal funds rate. The list comes from the Federal Reserve's open market operations page, read on 6 November 2026. It shows 17 increases since December 2017, seven of them in 2022.
- Which day: the page dates each change from the day after the statement, so each row was moved back one day to the statement day.
- Timing: the statement comes out at 14:00 New York time, which is 18:00 or 19:00 UTC, before the 00:00 UTC daily close. So the candle of the hike day holds the first hours of the reaction.
- The move: Bitcoin close to close on Binance BTCUSDT daily candles (UTC), from the close before the statement day to the close of that day. Closed candles only.
- Ordinary days: every daily change from 1 December 2017 to 5 November 2026, 3,262 days, hike days included.
- The day after: the next daily candle, close to close.
The Answer First: What Happens to Bitcoin When the Fed Raises Rates
Bitcoin closed lower on 6 of the 17 hike days (35.29%), against 49.08% of all days in the same years. Its average move on a hike day, up or down, was 2.25%, and on all days 2.27%.
On this record, a hike day was an ordinary day for Bitcoin. The day after was not: its average move was 3.48%, and it moved more than the hike day itself 10 times out of 17. These are past figures from 17 days, a small sample, and not a forecast.
Hike Day by Hike Day, 2017 to 2026
| Statement day | Hike | New target range | Bitcoin that day | Bitcoin the day after |
|---|---|---|---|---|
| 13 Dec 2017 | 0.25 pt | 1.25% to 1.50% | -1.94% | +1.88% |
| 21 Mar 2018 | 0.25 pt | 1.50% to 1.75% | -0.28% | -1.82% |
| 13 Jun 2018 | 0.25 pt | 1.75% to 2.00% | -3.63% | +5.45% |
| 26 Sep 2018 | 0.25 pt | 2.00% to 2.25% | +0.27% | +3.46% |
| 19 Dec 2018 | 0.25 pt | 2.25% to 2.50% | +0.25% | +10.58% |
| 16 Mar 2022 | 0.25 pt | 0.25% to 0.50% | +4.67% | -0.48% |
| 4 May 2022 | 0.50 pt | 0.75% to 1.00% | +5.20% | -7.90% |
| 15 Jun 2022 | 0.75 pt | 1.50% to 1.75% | +2.02% | -9.66% |
| 27 Jul 2022 | 0.75 pt | 2.25% to 2.50% | +7.99% | +3.88% |
| 21 Sep 2022 | 0.75 pt | 3.00% to 3.25% | -2.19% | +5.09% |
| 2 Nov 2022 | 0.75 pt | 3.75% to 4.00% | -1.62% | +0.28% |
| 14 Dec 2022 | 0.50 pt | 4.25% to 4.50% | +0.16% | -2.51% |
| 1 Feb 2023 | 0.25 pt | 4.50% to 4.75% | +2.63% | -1.03% |
| 22 Mar 2023 | 0.25 pt | 4.75% to 5.00% | -3.04% | +3.83% |
| 3 May 2023 | 0.25 pt | 5.00% to 5.25% | +1.24% | -0.65% |
| 26 Jul 2023 | 0.25 pt | 5.25% to 5.50% | +0.42% | -0.44% |
| 16 Sep 2026 | 0.25 pt | 3.75% to 4.00% | +0.74% | +0.28% |
The median change on a hike day was +0.27%. All six falls were under 4%, and the largest move on a hike day was a rise of +7.99% on 27 July 2022.
The seven hikes of 2022 tell the same story. Bitcoin rose on five of those seven statement days, including two of the four with a 0.75 point hike. Yet Bitcoin fell through most of 2022: the falls came between the meetings, not on them.
The hike of 16 September 2026 moved the target range to 3.75% to 4.00%. Bitcoin rose 0.74% that day and 0.28% the day after.
Hike Days vs Ordinary Days, and the Day After
| Measure | 17 hike days | The day after | All days, 1 Dec 2017 to 5 Nov 2026 |
|---|---|---|---|
| Closed lower | 6 of 17 (35.29%) | 8 of 17 (47.06%) | 49.08% |
| Median change | +0.27% | +0.28% | +0.05% |
| Average absolute move | 2.25% | 3.48% | 2.27% |
The columns for hike days and for all days are close on every line. The column for the day after is where the size changes: an average absolute move of 3.48% is about half as large again as an ordinary day.
The three largest moves on the day after were +10.58% on 20 December 2018, -9.66% on 16 June 2022 and -7.90% on 5 May 2022. In June 2022 Bitcoin rose 2.02% on the hike day, then fell 9.66% the next day.
One reason fits the timing: the statement lands five to six hours before the daily close, so the next candle is the first full day of trading after the decision. The direction of the day after was close to a coin toss, though: eight falls and nine rises.
What It Means for a Rule That Trades Daily Closes
A rule that trades daily closes only sees the move at the next close. On a hike day, the earliest it can act is the close of that day; the larger move of the day after then plays out over the next full candle.
The two backtests below show the bigger picture in the same years. The first is holding Bitcoin from 1 August 2021: its worst drawdown was 76.63%, from 8 November 2021 to 21 November 2022, the year of seven hikes.
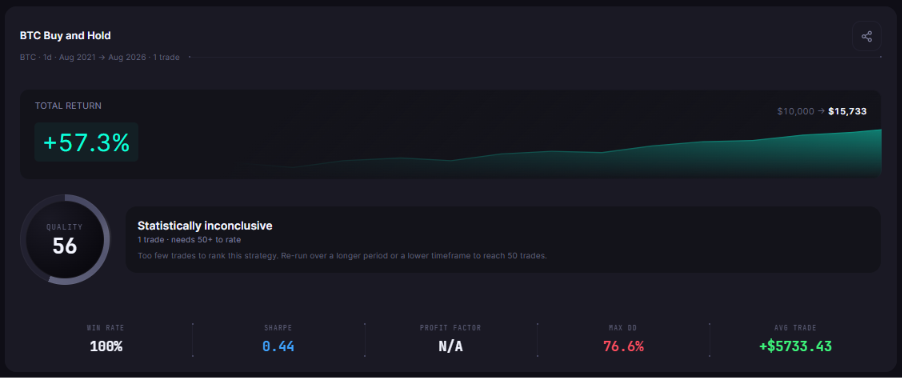
BTC Buy and Hold 1D 2021-2026 (shown in the app as BTC Buy and Hold), tested from August 2021 to August 2026: one trade, +57.3%, $10,000 to $15,733, QUALITY 56 next to "Statistically inconclusive" and MAX DD 76.6%.
The second is BTC RMA 50 Close Cross 1D 2021-2026, a trend rule that trades daily closes, over the same window. It buys when the close crosses above the 50-period RMA (a smoothed moving average) and sells when it crosses below. Its worst drawdown was 31.69%, from 13 March 2024 to 10 October 2024. Inside 2022 its deepest point was 27.43%, as the rule stepped aside for much of the fall.
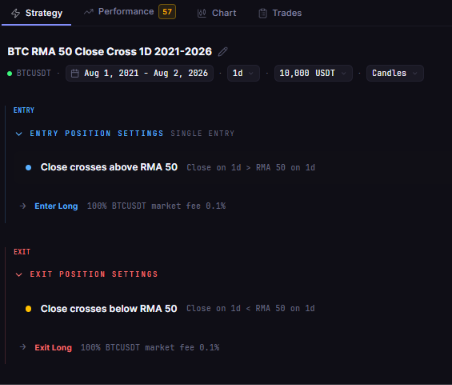
The stored rule of BTC RMA 50 Close Cross 1D 2021-2026 on BTCUSDT daily candles: enter long when the close crosses above the 50 period RMA, listed above the exit when the close crosses back below it.
The rule made 34 trades, so its results card marks it "Statistically inconclusive": it needs 50+ trades to rate, and its QUALITY score of 57 sits next to that label. Read its drawdown as one path, not as proof.
The lesson from both backtests is the same: the 2022 hikes sat inside a long fall, but the hike days themselves were ordinary. For the wider question of trading around scheduled news, see Should a Crypto Strategy Sit Out CPI and Fed Days? What a Backtest Can Show You. For one rule traded through the whole hiking cycle, see How a Volume Pressure Rule Traded BNB Through the 2022 Rate Hikes (2021-2026).
The Practical Lesson
- Check the base rate first: on 17 hike days since 2017, Bitcoin fell on 6 and moved about as much as on any day.
- Look at the day after: the larger moves came on the next daily candle, in both directions.
- Remember the clock: a rule that trades daily closes only sees the move at the next close, five to six hours after the statement.
Do not build a rule around one scheduled day before you have checked how that day behaved in the past. In CoinQuant you can describe a rule in plain English, test it on daily candles and read its trades by date.
Build trading strategies on real data. No coding required.
Frequently Asked Questions
Does Bitcoin go down when the Fed raises rates?
Not usually on the day itself. Since December 2017, Bitcoin closed lower on 6 of the 17 hike days, and its average move on those days (2.25%) matched all days (2.27%). The day after moved more, with an average absolute move of 3.48%.
What happened after the 16 Sep 2026 hike?
The Fed raised its target range by 0.25 points to 3.75% to 4.00%. Bitcoin rose 0.74% on the statement day and 0.28% the day after, on Binance daily closes.
What are the odds of a hike on 9 Dec?
On 6 November 2026, after the October jobs report, traders priced a 76.8% chance of another 0.25 point hike at the 8 to 9 December meeting, according to CME FedWatch as reported in CNBC's jobs report coverage. Odds like these change daily, so check the current figure before you act on it.
Check a scheduled day's base rate before you trade it.
Disclaimer:
This content is for educational and informational purposes only and does not constitute financial, investment, or trading advice. All strategies and examples are for illustrative purposes and do not guarantee results. Always conduct your own research before making financial decisions.