
Should a Crypto Strategy Sit Out CPI and Fed Days? What a Backtest Can Show You

Crypto trading around CPI and FOMC releases raises the same question every few weeks: should a strategy stand aside, or trade through? A backtest cannot answer that with a forecast. It can show what your own rule did on past release days, if you know where to look in the trade log.
This guide shows you how, using a 4-hour Bitcoin RSI strategy with 401 trades. The example produces a striking split: the 29 trades that held a position through a CPI release bar netted +$28,960.03 after fees, while the other 372 trades netted -$26,153.99. That split is easy to misread, and most of this guide explains why.
The author ran the backtest on CoinQuant, an AI trading platform. This guide reports the numbers without adjustment.
Crypto Trading Around CPI and FOMC: What Release Days Do to Prices
Two US releases arrive on a fixed calendar: the Consumer Price Index (CPI) from the Bureau of Labor Statistics at 8:30 a.m. Eastern Time (ET), and the Federal Open Market Committee (FOMC) statement from the Federal Reserve at 2:00 p.m. ET on the last day of each meeting.
The September 2026 CPI release, embargoed until "8:30 a.m. (ET) Wednesday, October 14, 2026", reports that the all items index rose 3.7% over the 12 months to September, before seasonal adjustment (BLS). Startup Fortune's report on the release said: "Stocks sold off within minutes of the 8:30 a.m. release." It added: "If stocks had a rough morning, crypto had a rough day." Moves like that are why CPI Bitcoin volatility gets so much attention.
The Fed publishes its FOMC meeting dates ahead of time on its meeting calendar. Nobody can tell you in advance how prices will react to a meeting. What you can check is how your own rule behaved around the releases it has already lived through.
Can a Strategy That Reads Only Price Know It Is CPI Day?
No. The example strategy reads 4-hour price bars and nothing else. This test has no calendar or event setting, so the rule trades a CPI morning exactly as it trades any other morning. It is not an FOMC crypto trading strategy or a CPI one.
That matters for reading the results. Any link you find between release days and profits comes from splitting one trade log after the fact. It is not a filter the strategy used, and it is not a forecast. That is the honest link between macro events and backtests.
Here is the example rule in plain English, as you would type it into CoinQuant, with no coding required:
Buy BTCUSDT on the 4-hour chart when RSI(14) crosses above 50. Sell when it crosses below 50. Test from January 1, 2023 to August 1, 2026 with $10,000, 100% of equity per trade and a 0.1% fee.
The library version of this idea is AI RSI 4H Cross Strategy: an RSI(14) cross of 50, entering on the cross above 50 and exiting on the cross below.
How to Find Release Day Trades in Your Trade Log
A release day trade is one that was open when a scheduled release came out. In a CoinQuant backtest you find them on the Trades tab, where every order carries a UTC date and time. Five steps get you there:
- List the release dates: take CPI dates from the BLS release archive and FOMC statement days from the Fed calendar. Our window holds 42 CPI releases and 29 FOMC statement days. BLS did not publish an October 2025 CPI because of the 2025 lapse in federal funding.
- Convert release times to UTC: CPI at 8:30 a.m. ET is 12:30 UTC in US summer time and 13:30 UTC in winter, always inside the 4-hour bar from 12:00 to 16:00 UTC, and the FOMC statement at 2:00 p.m. ET always falls inside the 16:00 to 20:00 UTC bar.
- Define before you count: here, a trade counts as a "CPI day" trade if it held a position through the whole 4-hour bar that contains the 8:30 a.m. ET release (the 12:00 to 16:00 UTC bar).
- Match the rows: each trade is two rows in the log, an Entry and an Exit, so compare both order times with the release bar.
- Add up the exit rows: the Exit row carries each trade's Net PnL after both fees. Sum it for the event trades and for all the others.
Take the CPI release of 12 June 2024. The log shows an Entry at 12:00 UTC and an Exit at 16:00 UTC that day, so that trade held through the whole release bar. It still lost $618.34 after fees.
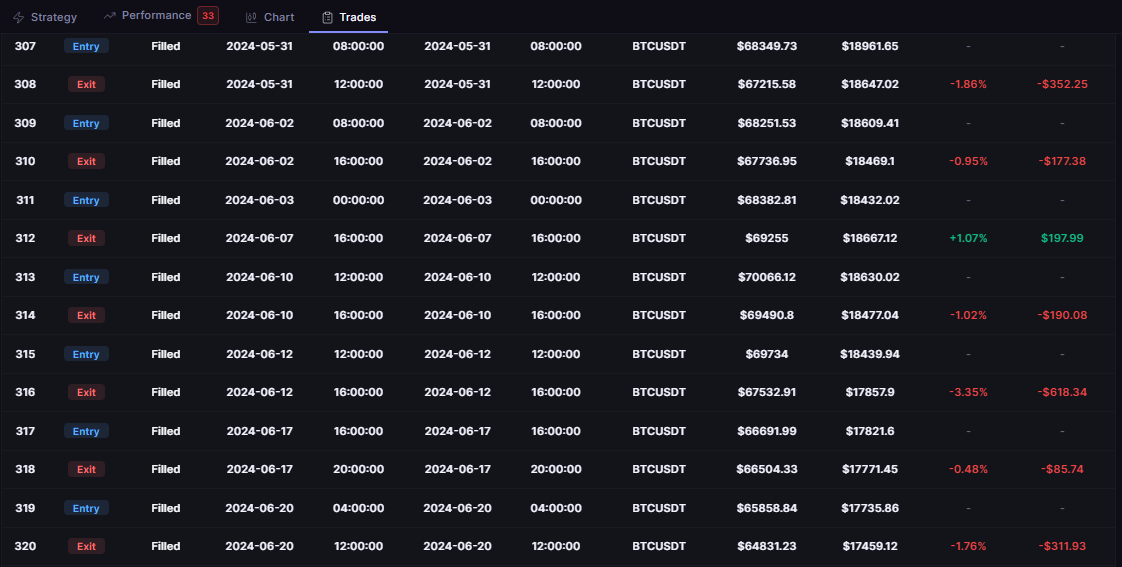
AI RSI 4H Cross Strategy trade log, times in UTC: order row 315 is a Filled Entry at 12:00 and order row 316 a Filled Exit at 16:00 on 12 June 2024, the day of a US CPI release.
Example: A 4-Hour Bitcoin Strategy's Log
AI RSI 4H Cross Strategy traded BTCUSDT (spot, Binance) on 4-hour bars from 2023-01-01 to 2026-08-01, with $10,000, 100% of equity per entry and a 0.1% fee on entry and on exit. No slippage was modelled. It turned $10,000 into $12,806.09, a Total Return of 28.06%, across 401 trades.
The other figures show a thin edge. The Win Rate was 20.95%, the Profit Factor 1.04, the Sharpe Ratio 0.37 and the Max Drawdown 58.45%. Fees came to $14,471.38, more than the whole net profit.
| Group (split made afterwards) | Trades | Winners | Net PnL after fees |
|---|---|---|---|
| Held through a CPI release bar | 29 | 21 | +$28,960.03 |
| All other trades (CPI split) | 372 | 63 | -$26,153.99 |
| Held through an FOMC statement bar | 13 | 7 | +$13,286.12 |
| All other trades (FOMC split) | 388 | 77 | -$10,480.08 |
Read literally, the CPI trades carried the whole strategy. Now change the definition. Counting only trades entered on the release date (UTC) gives 16 CPI trades and +$862.83, so the definition changes the answer.
Because the run clears 50 trades, its results card is not marked "Statistically inconclusive".
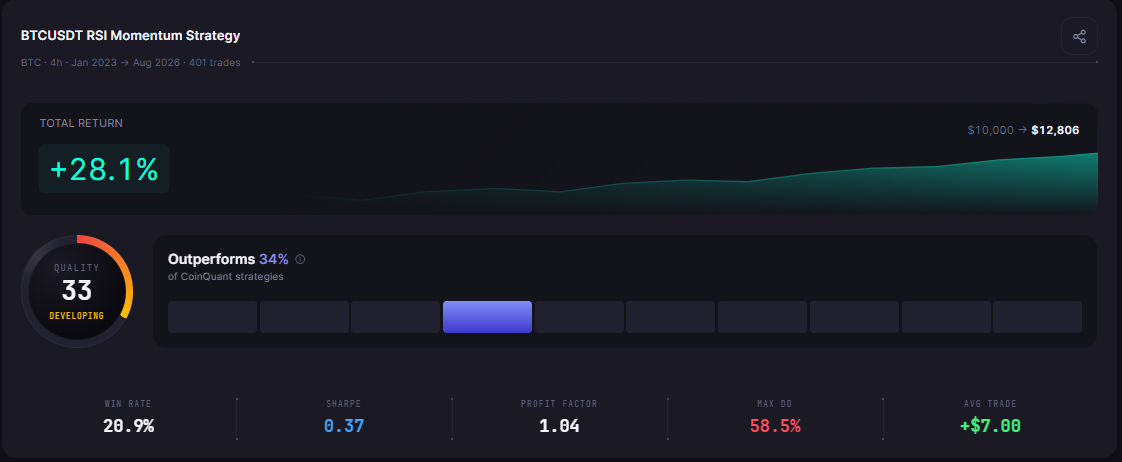
AI RSI 4H Cross Strategy results card: 401 trades on 4-hour Bitcoin bars, +28.1%, $10,000 to $12,806, Quality score 33.
Sitting Out vs Trading Through: What to Test
One likely explanation for the big CPI number is simpler than "CPI days pay": selection bias. The median trade lasted three 4-hour bars, but the mean was 10.33 bars, because a few winners ran for days. A long trade covers many more bars, so it is far more likely to be open across a release bar.
The single best trade illustrates the point. It was held for 112 bars from 5 to 24 November 2024, made $8,135.75 after fees and was open across both a CPI bar and an FOMC bar. Long winners are more likely to land in the event group simply because they are long.
So test the questions a trade log can actually answer:
- Holding time: compare long and short trades first, then see whether the event split adds anything.
- Definition: try a stricter and a looser version and keep the one you wrote down first.
- Outliers: check whether the event group still looks good without its largest trade.
- Another rule: run the same split on a second strategy before you believe it.
Common Mistakes
- Treating a split as a filter: the strategy never skipped or chose a release; you sorted its trades afterwards.
- Moving the definition: changing what counts as an event trade until the numbers look good.
- Mixing time zones: the log is in UTC, the releases are announced in Eastern Time, and US daylight saving time shifts the gap.
- Missing dates: releases move, and some are skipped, like the October 2025 CPI.
For the bigger picture of when a strategy suits the market, see understanding market regimes. For the costs that can erase a thin edge like this one, read why fees, slippage and data mode decide whether results are real.
The Practical Lesson
- Define first, count second: "held through the release bar" gave +$28,960.03; "entered on the release date" gave +$862.83.
- Check holding time: long trades cross more release bars, so they crowd the event group.
- Read it as history, not a signal: a split of one log made after the fact is not a reason to trade or to sit out.
Before the next CPI or Fed date, open your own strategy's Trades tab, convert the release time to UTC and see which trades were open. Then decide with your own data in front of you.
Build trading strategies on real data. No coding required.
Frequently Asked Questions
Should I trade crypto on CPI day?
A backtest cannot tell you that in advance. It can show how your own rule's trades behaved around past releases. In this example, the strategy's best trade was one of the trades open across a CPI bar, and long trades cross more release bars anyway.
What time is CPI released in UTC?
BLS releases CPI at 8:30 a.m. ET. That is 12:30 UTC during US daylight saving time and 13:30 UTC in winter, so it always falls inside the 4-hour bar from 12:00 to 16:00 UTC.
Can a backtest skip FOMC days?
Not this one: the rule reads price only and has no calendar or event setting. You can still read its Trades tab against the Fed's meeting calendar to see which trades were open when a statement came out.
Check your own rule's trade log against the next CPI and Fed dates.
Disclaimer:
Key Takeaway