
Volume Surge Strategy on Ethereum: What Happens When Trading Volume Spikes Above Its 20-Period Average

Volume analysis sits at the foundation of most breakout trading logic. When price moves on high volume, the move has broader participation behind it. When price moves on thin volume, the move is likely to fade. The volume surge breakout strategy attempts to turn this reasoning into a mechanical trading rule.
This article runs a volume surge breakout strategy on Ethereum across daily and four-hour timeframes and reports the results from CoinQuant backtest data covering August 3, 2025 to August 3, 2026. Fees and slippage are included. The numbers tell a story about what volume spikes actually signal in a range-bound market, and what happens when you trade them more frequently.
What the Volume Surge Breakout Strategy Does
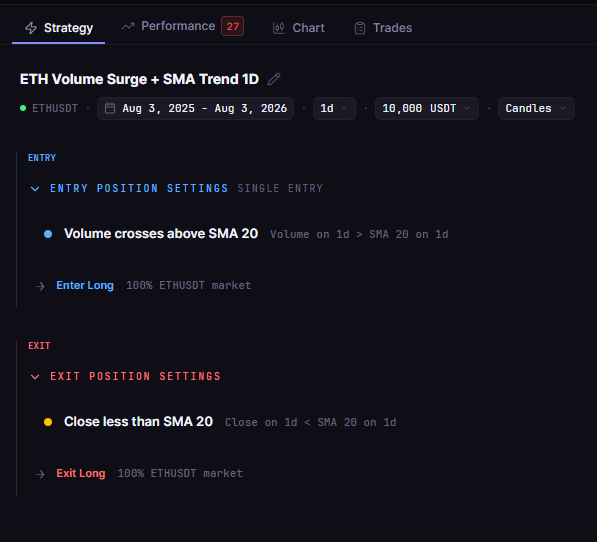
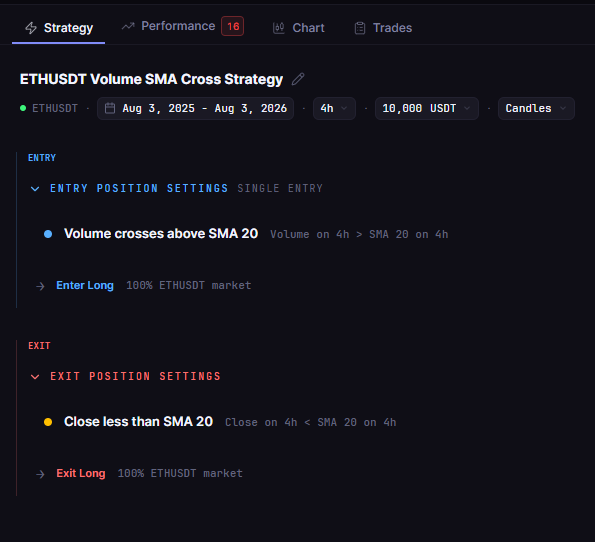
The strategy uses traded volume compared against its own moving average as the sole entry trigger:
Entry: Long when Ethereum's traded volume crosses above the 20-period simple moving average of volume
Exit: Long when volume drops back below the 20-period SMA
The setup treats a volume spike above the SMA as evidence of elevated market participation, which historically correlates with directional price moves. No price confirmation is required. The strategy enters purely on the volume condition.
This is different from volume-weighted price indicators like OBV or MFI. This strategy uses raw volume versus its own average as a standalone signal, making it a direct test of whether volume spikes alone are predictive of profitable price moves on Ethereum.
Test Setup
| Parameter | Value |
|---|---|
| Asset | ETHUSDT (Binance Spot) |
| Indicator | Volume vs 20-Period SMA of Volume |
| Timeframes Tested | Daily (1D), Four-Hour (4H) |
| Test Window | August 3, 2025 to August 3, 2026 |
| Fees and Slippage | Included |
| Data Source | Kaiko via CoinQuant |
Daily Results: 34 Trades, -18.2%
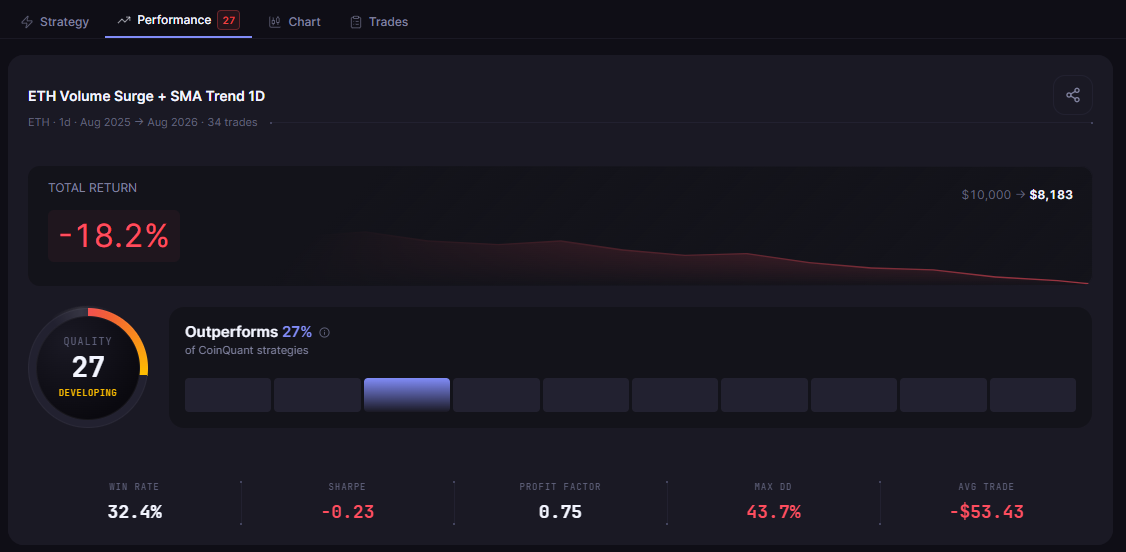
"ETH Volume Surge Breakout 1D" generated 34 trades over 12 months, with a win rate of 32.4% and a total return of -18.2%. The maximum drawdown reached 43.7%.
The win rate indicates that roughly one in three daily volume surge signals led to a winning trade. The maximum drawdown of 43.7% reflects that some of those losses were large, as the strategy held through periods where volume stayed elevated while Ethereum's price continued to fall.
| Strategy | Total Return | Total Trades | Win Rate | Max Drawdown | Sharpe Ratio | Profit Factor |
|---|---|---|---|---|---|---|
| ETH Volume Surge Breakout 1D | -18.2% | 34 | 32.4% | 43.7% | -0.23 | 0.75 |
| ETH Volume Surge Breakout 4H | -40.1% | 222 | 39.2% | 57.6% | -1.13 | 0.75 |
Four-Hour Results: 222 Trades, -40.1%
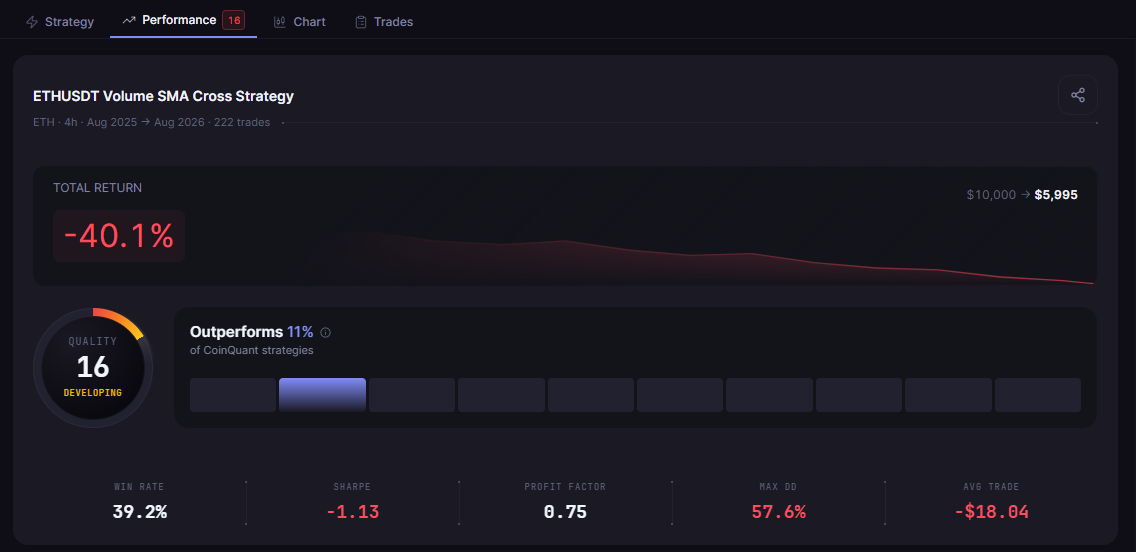
The four-hour backtest produced a result that inverts the usual expectation: more trades, higher win rate, and a far worse outcome.
"ETH Volume Surge Breakout 4H" generated 222 trades with a win rate of 39.2% and a total return of -40.1%. The maximum drawdown reached 57.6%, more than 13 percentage points deeper than the daily strategy.
The win rate is actually higher on the four-hour chart (39.2% vs 32.4%). This makes the -40.1% total return more counterintuitive at first glance. The explanation comes down to the ratio of wins to losses and the compounding effect of trade frequency. With 222 trades in 12 months, losses accumulate rapidly. Even a win rate close to 40% is insufficient to overcome a loss expectancy when the losses are consistently larger than the wins across a sustained range market. The daily strategy's 34 trades limited the total capital at risk, which is why the outcome was materially better despite the lower win rate.
What Volume Spikes Actually Signal
The contrast between daily and four-hour results reveals something important about volume analysis in range markets.
Volume spikes tell a trader that something happened: more participants showed up to trade at that moment than usual. What volume spikes do not tell a trader is what happens next. In a trending market, elevated volume during an upswing often indicates that a genuine directional move has institutional backing. In a range-bound market, volume spikes frequently occur at support and resistance levels where both buyers and sellers are active simultaneously, as one side attempts a breakout and the other fades it.
Ethereum traded in a range-bound environment for much of August 2025 to August 2026. In that context, volume surges above the 20-period SMA were regularly associated with contested price levels, not sustained directional moves. Entering long on every such spike meant buying into resistance tests that resolved downward more than a third of the time on the daily chart, and closer to 61% of the time on the four-hour chart after accounting for all trades.
The four-hour chart amplified this problem by identifying volume spikes that a daily trader would not even see, generating 222 entries in situations where the daily chart stayed flat. Most of those additional entries were noise: brief volume events within a day that did not correspond to any sustained directional move at the session level.
Why More Trading Made It Worse
The four-hour result, 222 trades at -40.1%, illustrates a specific failure mode worth understanding.
Strategies that react to short-term signals on lower timeframes assume that those signals carry the same information content as signals on higher timeframes. They usually do not. A volume spike on a four-hour chart is a four-hour event. A volume spike on a daily chart is a full-day event that required sustained elevated participation across multiple four-hour windows to register.
The daily volume surge is a more demanding filter. It takes more for a volume event to register as a surge on the daily chart than on the four-hour chart, which is why the daily chart produced 34 signals versus 222 on the four-hour. Each daily signal carried more information, which is reflected in the higher-quality (though still net-negative) outcome.
A loss of -18.2% with 34 trades versus a loss of -40.1% with 222 trades over the same period shows that the additional trade frequency added no value. It added costs, capital exposure, and opportunity to be on the wrong side of a range-bound market's failed breakouts.
The Practical Lesson
The volume surge breakout strategy on Ethereum produced negative returns on both tested timeframes during the August 2025 to August 2026 window. Neither result was profitable, and the four-hour configuration was significantly worse than daily despite producing a higher individual trade win rate.
Three conclusions stand out from the data:
Raw volume surges above a 20-period SMA are not sufficient as a standalone entry signal in a range-bound Ethereum market.
Lower timeframes amplify the problem by generating more signals in exactly the conditions where signal quality is lowest.
The win rate being higher on the four-hour chart (39.2%) than the daily chart (32.4%) while the total return is worse (-40.1% vs -18.2%) confirms that win rate alone is not a proxy for strategy quality.
Volume analysis becomes more useful when combined with price confirmation. A standalone volume entry removes that confirmation entirely, leaving the strategy fully exposed to volume events that do not lead anywhere directionally. Running this with a price breakout condition added, or testing across a period that includes stronger Ethereum trend moves, would provide a more complete picture of where volume surge entries add value.
Disclaimer:
Key Takeaway
