
Klinger Oscillator Zero-Line Strategy on XRP: Daily Backtest Results (2021-2026)
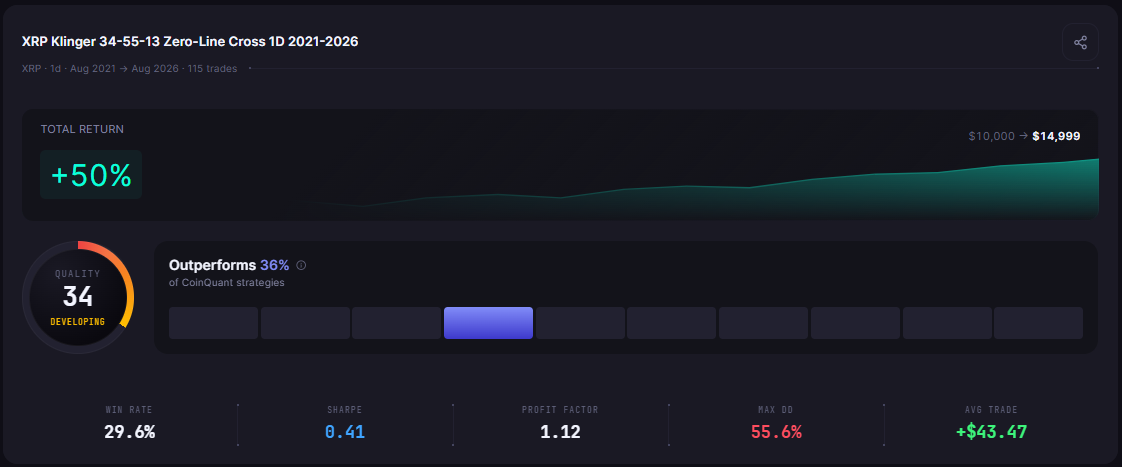
A Klinger Oscillator zero line strategy buys when the Klinger Volume Oscillator (KVO) crosses above zero and sells when it crosses back below. On daily XRP from August 2021 to August 2026, it turned $10,000 into $14,999.00, a 49.99% Total Return across 115 trades, while holding XRP returned 46.13%.
The edge was thin. The Max Drawdown of 55.60% beat the 77.87% of buy and hold, but one trade in late 2024 earned more than four times the final net profit, and holding Bitcoin (57.33%) beat both.
This article runs five years of XRPUSDT daily data with a 0.1% fee on every fill and reports the results without adjustment. No tuned parameters, no cherry picked dates.
The Rule: How the Klinger Oscillator Zero Line Strategy Works
The Klinger Volume Oscillator measures volume force, the push behind price. CoinQuant's documentation describes it as a fast exponential moving average of volume force minus a slow one, plotted around a zero line, and sums up the zero line plainly: "above zero is bullish flow, below is bearish."
- KVO line: the fast average minus the slow one (34 and 55 periods, the common settings)
- Signal line: a 13 period average of the KVO line, used for the more familiar signal line cross
A zero line cross reads the direction of volume pressure, not its turns. The signal period is stored with the indicator, but this rule reads the KVO line only, so it plays no part in the trades.
Test Setup
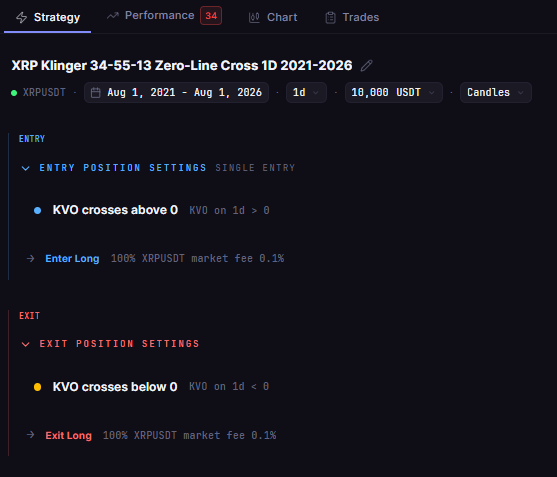
The strategy comes from Nada's CoinQuant Strategy Library as XRP Klinger 34-55-13 Zero-Line Cross 1D 2021-2026. In CoinQuant, an AI trading platform, you describe a rule like this in plain English and the platform backtests it on historical data, no coding required. KVO joined CoinQuant's indicator list on January 26, 2026.
Buy XRPUSDT on the daily chart when the Klinger Volume Oscillator (34, 55, 13) crosses above 0. Sell when it crosses below 0. Test from August 1, 2021 to August 1, 2026 with $10,000, 100% of equity per trade and a 0.1% fee.
| Parameter | Setting |
|---|---|
| Strategy | XRP Klinger 34-55-13 Zero-Line Cross 1D 2021-2026 |
| Instrument | XRPUSDT (spot, Binance) |
| Data source | Kaiko via CoinQuant |
| Timeframe | Daily (1D) |
| Tested window | 2021-08-01 to 2026-08-01 |
| First trade to last exit | 2021-08-27 to 2026-08-01 |
| Entry | KlingerVolumeOscillator(fast=34, slow=55, signal=13, output=kvo) crosses above 0 on 1d timeframe, market order |
| Exit | KlingerVolumeOscillator(fast=34, slow=55, signal=13, output=kvo) crosses below 0 on 1d timeframe, market order |
| Direction | Long only, one position at a time, no leverage |
| Initial capital | $10,000 |
| Position size | 100% of equity per entry |
| Fees | 0.1% taker fee on entry and on exit (no slippage set) |
| Baselines (same window) | XRP Buy and Hold 1D 2021-2026; BTC Buy and Hold 1D 2021-2026 |
There is no stop loss, take profit or trend filter. The Strategy tab lists one entry condition above one exit condition, exactly as tested.
Results vs XRP Buy and Hold
The zero line rule finished slightly ahead of holding XRP and behind holding Bitcoin. Its real advantage was a shallower fall, and it sat in cash for more than half of the window.
| Metric | Klinger zero line | XRP buy and hold | BTC Spot Comparison |
|---|---|---|---|
| Strategy | XRP Klinger 34-55-13 Zero-Line Cross 1D 2021-2026 | XRP Buy and Hold 1D 2021-2026 | BTC Buy and Hold 1D 2021-2026 |
| Total Return | 49.99% | 46.13% | 57.33% |
| Final Balance | $14,999.00 | $14,613.11 | $15,733.43 |
| Total Trades | 115 | 1 | 1 |
| Win Rate | 29.57% (34W / 81L) | n/a (single hold) | n/a (single hold) |
| Profit Factor | 1.12 | n/a (single hold) | n/a (single hold) |
| Sharpe Ratio | 0.41 | 0.49 | 0.44 |
| Max Drawdown | 55.60% | 77.87% | 76.63% |
| Total Fees | $2,735.75 | $24.62 | $25.74 |
All three runs share the same window, capital, sizing and 0.1% fee, so the rows compare like with like.
The Sharpe Ratio tempers the headline: 0.41 against 0.49 for holding XRP, so the extra return did not come with a smoother ride. The platform's Buy and Hold benchmark carries no fees and ends at 46.42%, so the table uses the XRP Buy and Hold 1D 2021-2026 strategy (46.13%), which pays the 0.1% fee on entry and exit.
With 115 trades, the run clears the 50 trade bar CoinQuant uses to rate a backtest, and the Performance tab results card gives it a Quality score of 34.
Data note: the XRPUSDT daily series on CoinQuant is missing 2021-09-09 to 2021-09-15, and the platform does not flag it. No trade spans the gap (one closed on 2021-09-07 and the next opened on 2021-10-02), but the KVO values behind the October 2021 trades were computed across the missing days.
What the Trades Show
The rule made 115 round trips from its first entry on 2021-08-27 to its last exit on 2026-08-01, when the final trade, still open, was closed at the last bar. It spent 45.33% of the window in the market.
Many Small Losses, a Few Large Wins
Only 34 of the 115 trades made money. The median trade lost 2.02% after fees, and the worst run was eight losses in a row.
| Trade breakdown | XRP Klinger 34-55-13 Zero-Line Cross 1D 2021-2026 |
|---|---|
| Winning / losing trades | 34 / 81 |
| Average win / average loss (after fees) | 17.58% / -3.82% |
| Worst trade in dollars (after fees) | -9.02%, 2025-01-16 to 2025-01-19, -$2,242.30 |
| Longest losing streak | 8 trades |
| Average holding period | 7.37 days |
Large average wins are why a Win Rate under one in three still produced a Profit Factor of 1.12: $1.12 of gross profit for every dollar of gross loss, a narrow margin.
One Trade Carried the Result
The best trade bought XRP on 2024-11-04 and sold on 2024-12-10 for 370.31% after fees, adding $21,112.26. That is more than four times the final net profit of $4,999.00, so the other 114 trades, taken together, lost money. Fees of $2,735.75 took more than half as much as the strategy finally earned.
Zero Line vs Signal Line: What Changes
The more common way to trade the Klinger Oscillator is the signal line cross. The Klinger Volume Oscillator strategy backtest on Bitcoin tested that version: buy when KVO crosses above its signal line while KVO is above zero, and sell on the cross back below the signal line.
| Dimension | Zero line (this test) | Signal line (the Bitcoin test) |
|---|---|---|
| Strategy | XRP Klinger 34-55-13 Zero-Line Cross 1D 2021-2026 | BTC Klinger 34-55-13 Cross 1D 2021-2026 |
| Entry | KVO crosses above 0 | KVO crosses above its signal line while KVO is greater than 0 |
| Exit | KVO crosses below 0 | KVO crosses below its signal line |
| Total Trades | 115 | 62 |
| Time in Market | 45.33% | 14.12% |
| Total Return | 49.99% | 72.39% |
| Max Drawdown | 55.60% | 28.23% |
The tests use different coins, so the returns are no verdict on which reading is better. The structure is the useful part: the zero line rule waits for volume force to change direction and stays in, while the signal line rule exits on each turn down and so held Bitcoin for only 14.12% of the window.
On Klinger signal line vs zero line, the two readings can also be combined: the Bitcoin rule uses the zero line as a filter and the signal line as the trigger. For a wider look at volume indicators on daily Bitcoin data, see MFI vs OBV on Bitcoin.
What This Test Cannot Tell You
This Klinger zero line cross backtest covers one coin, one five year window and one parameter set on daily bars. Another coin, timeframe or setting could change the result.
- Sample: 115 trades is enough for the card to rate the run, but one trade still decided the outcome
- Costs: fees are modelled at 0.1% per fill, but slippage was not set, so real fills could be slightly worse
- Concentration: one late 2024 trade earned more than the whole net profit, and the other 114 trades together lost money
- Data: the seven day XRP gap in September 2021 sits inside the window and affects the early KVO values
Past results do not predict future returns.
The Practical Lesson
On daily XRP the Klinger zero line fell less than buy and hold, but its profit came from one move.
- Return: 49.99% for the zero line rule against 46.13% for holding XRP and 57.33% for holding Bitcoin
- Risk: a 55.60% Max Drawdown against 77.87% for holding XRP, but a lower Sharpe Ratio (0.41 against 0.49)
- Edge: a 29.57% Win Rate, a Profit Factor of 1.12 and $2,735.75 in fees, with one trade earning more than the whole net profit
The next step is to test whether the edge survives without that one move. In CoinQuant you can run the same rule on another coin or add the signal line as a second condition (CoinQuant supports multi-indicator and multi-timeframe conditions). Each change needs its own backtest.
Build trading strategies on real data. No coding required.
Frequently Asked Questions
Does the Klinger Oscillator zero line strategy work on XRP?
Barely. On daily XRPUSDT from 2021-08-01 to 2026-08-01 it returned 49.99% over 115 trades against 46.13% for holding XRP, and one late 2024 trade earned more than the whole net profit.
Should I trade the Klinger Oscillator zero line or the signal line?
The zero line reads the direction of volume force and stays in longer; the signal line reads its turns and exits sooner. Here the zero line rule was in the market 45.33% of the time and the Bitcoin signal line rule 14.12%, but the tests used different coins, so test both on the coin you plan to trade.
What are the best Klinger Oscillator settings for crypto?
This test used only 34, 55 and 13, the common settings named in CoinQuant's documentation. Treat any other setting as a hypothesis until you backtest it.
Put your strategy to the test. Build and backtest it with CoinQuant. Backtest your strategy
Disclaimer:
Key Takeaway