
MFI vs OBV on Bitcoin: Which Volume Indicator Backtests Better? (Daily, Verified Backtests)
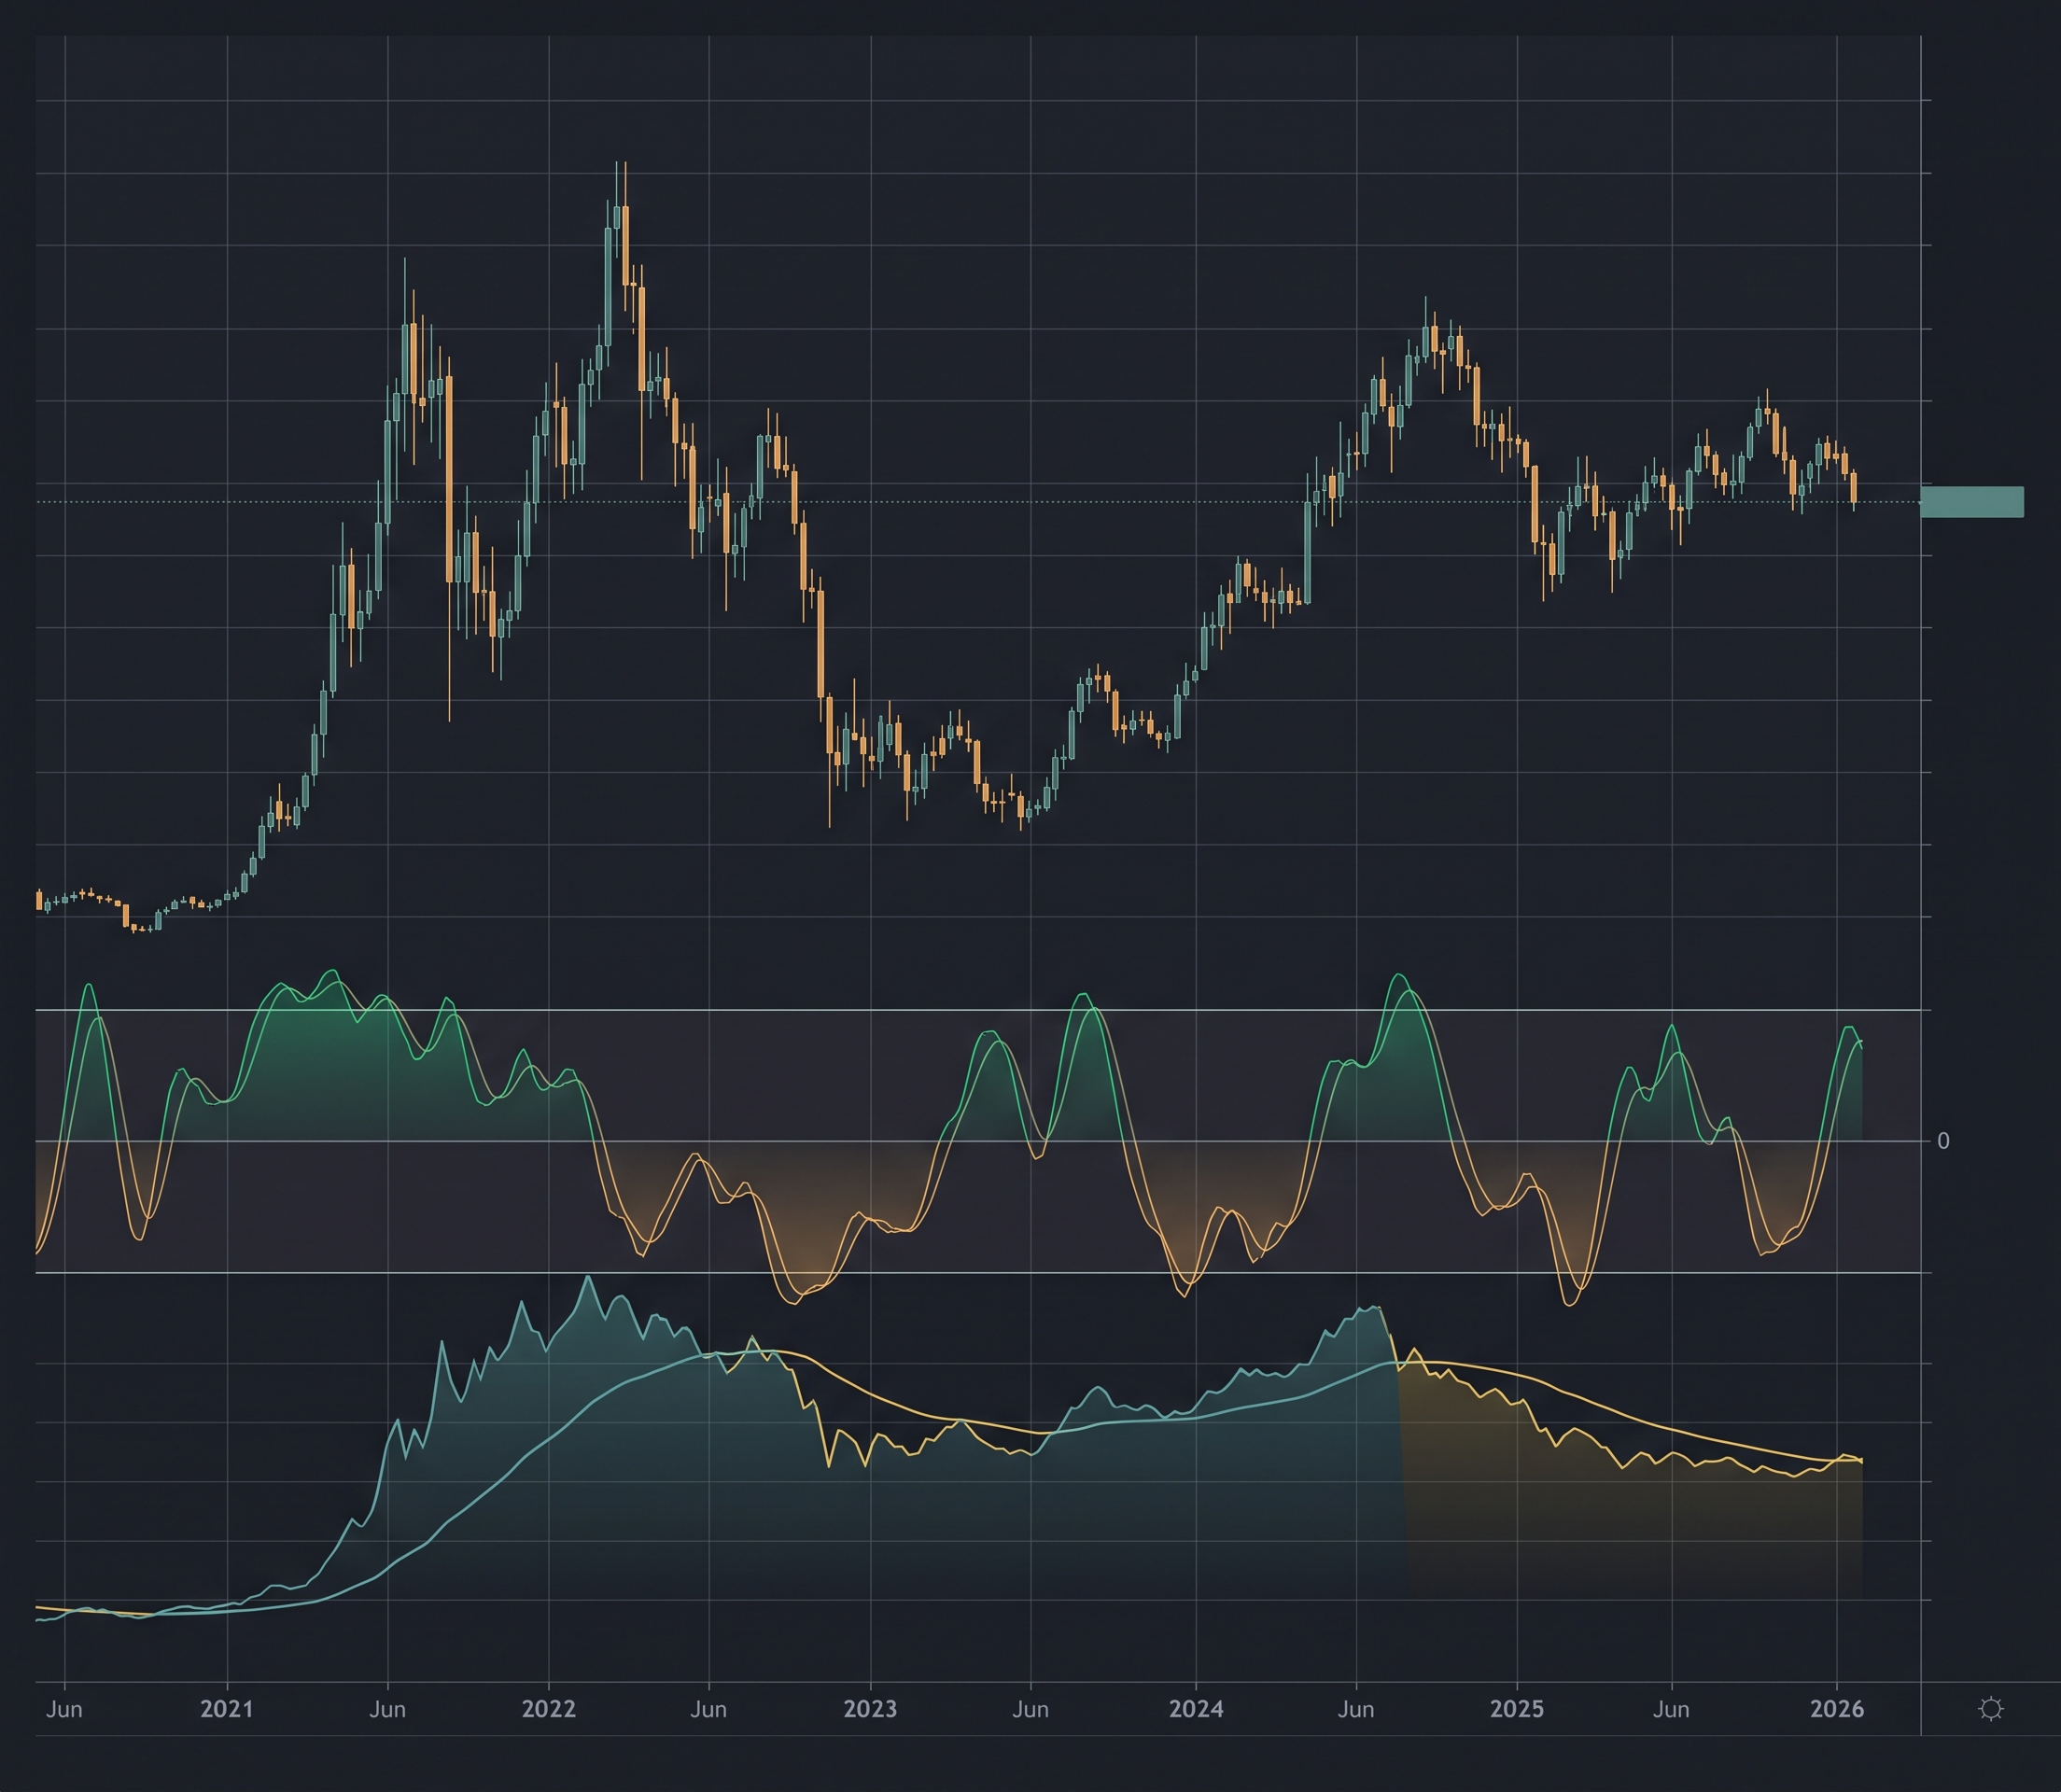
Money Flow Index and On-Balance Volume are the two volume indicators traders argue about most. MFI is a bounded oscillator that measures buying and selling pressure on a 0 to 100 scale. OBV is a cumulative line that adds volume on up days and subtracts it on down days. Both answer the same question, is volume confirming price, with completely different math.
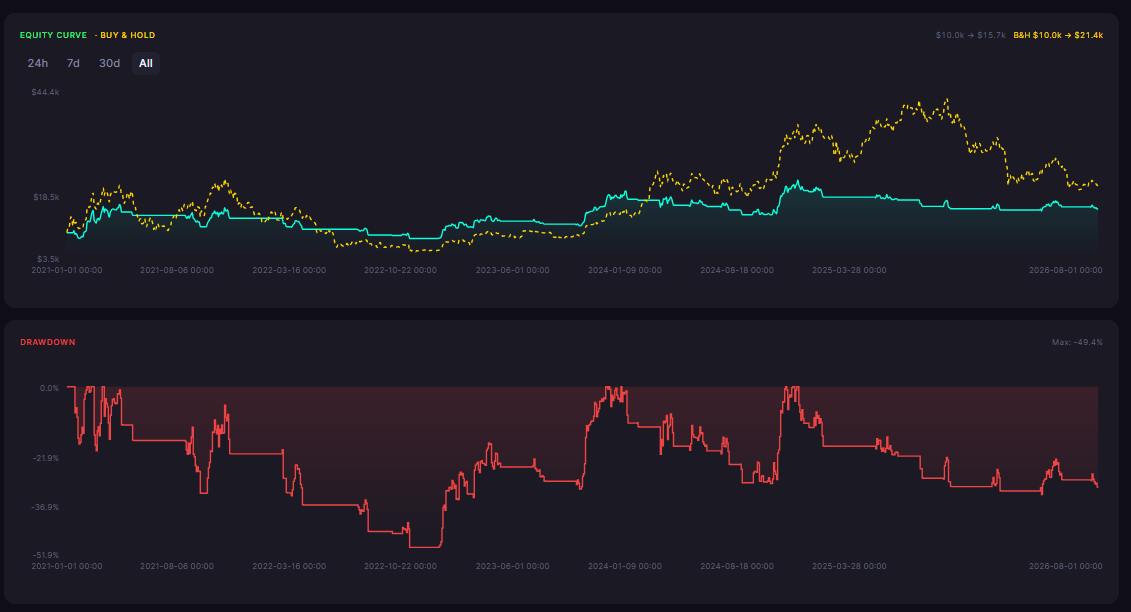
This article tests both families on Bitcoin with verified CoinQuant library strategies: BTC MoneyFlowIndex(14) Midpoint Cross 1D and BTC OBV(20) Trend 1D, both on BTCUSDT daily. The OBV strategy ran over the full 2021-2026 window. The MFI strategy's verified library backtest covers the 12 months from August 2025 to August 2026, and the article reports it exactly as run.
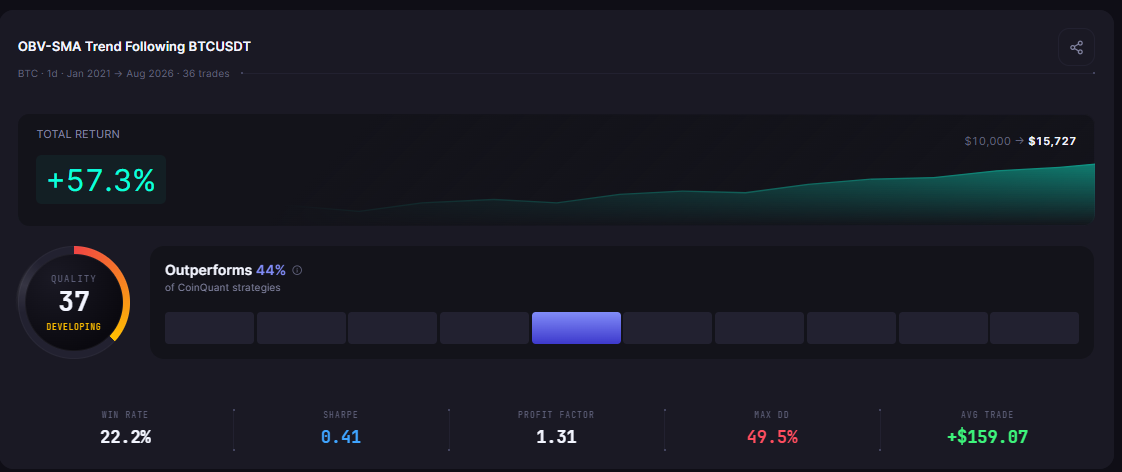
The result is a clean contrast: the OBV trend strategy made +57.27% over 5.6 years, and the MFI midpoint strategy lost 13.78% in its 12-month window.
What Each Strategy Does
The MFI midpoint strategy uses Money Flow Index as a standalone signal:
Entry: MFI(14) crosses above 50, the midpoint, meaning buying pressure has taken control
Exit: MFI(14) crosses below 50, meaning selling pressure has taken control
The OBV strategy uses On-Balance Volume as a trend filter with price confirmation:
Entry: OBV crosses above its SMA(20) while close is above the SMA(50)
Exit: close crosses below the SMA(50)
The design difference is the story. The MFI rule trades a single oscillator around its midpoint. The OBV rule requires volume and price to agree, and only acts in the direction of the longer trend.
Test Setup
| Parameter | MFI strategy | OBV strategy |
|---|---|---|
| Strategy (library names) | BTC MoneyFlowIndex(14) Midpoint Cross 1D | BTC OBV(20) Trend 1D |
| Instrument | BTCUSDT (spot) | BTCUSDT (spot) |
| Timeframe | Daily (1D) | Daily (1D) |
| Tested window | 2025-08-01 to 2026-08-01 (12 months) | 2021-01-01 to 2026-08-01 (5.6 years) |
| Direction | Long only, no leverage | Long only, no leverage |
| Initial capital | $10,000 | $10,000 |
| Fees | 0.1% taker, modeled | 0.1% taker, modeled |
| Data source | Kaiko via CoinQuant | Kaiko via CoinQuant |
The Backtest Results
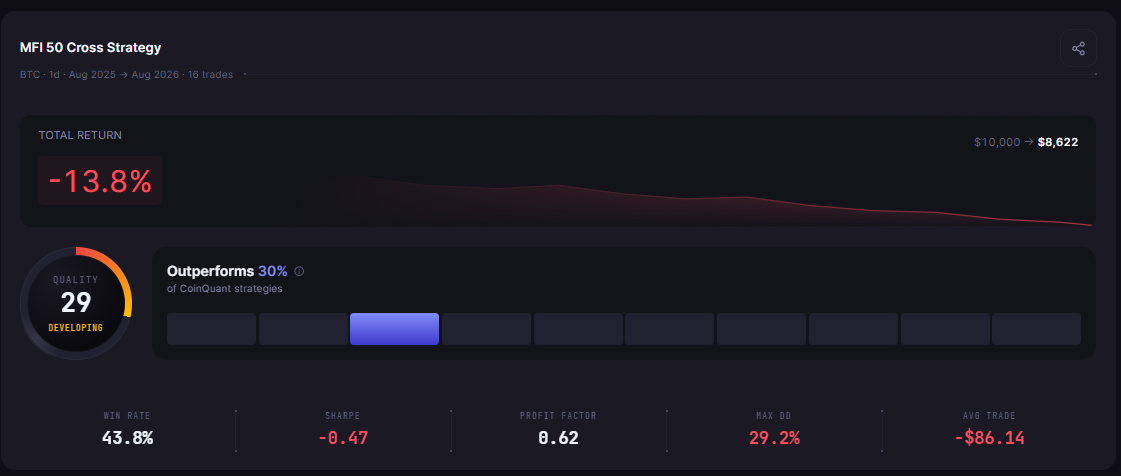
| Metric | MFI(14) Midpoint Cross 1D | OBV(20) Trend 1D |
|---|---|---|
| Total Return | -13.78% | +57.27% |
| Final Balance | $8,621.71 | $15,726.62 |
| Total Trades | 16 | 36 |
| Win Rate | 43.8% (7W / 9L) | 22.2% (8W / 28L) |
| Profit Factor | 0.62 | 1.31 |
| Sharpe Ratio | -0.47 | 0.41 |
| Sortino Ratio | -0.65 | 0.61 |
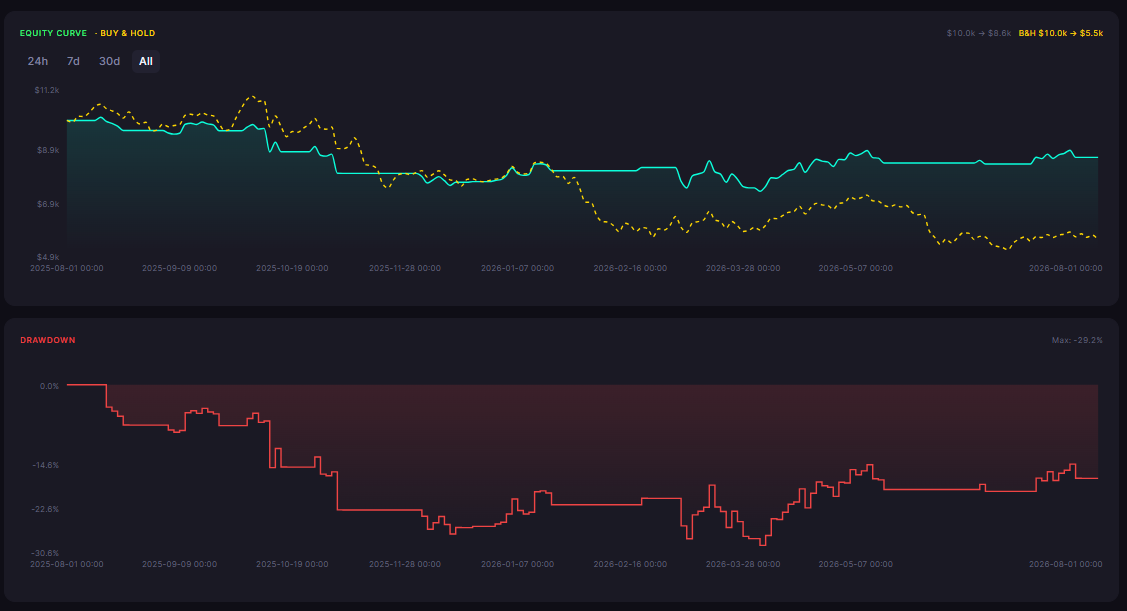
| Max Drawdown | 29.24% | 49.52% |
| Average Win | $319.24 | $3,006.25 |
| Average Loss | $401.44 | $654.41 |
| Best Trade | +$1,191.52 | +$6,027.68 |
| Worst Trade | -$806.54 | -$1,548.76 |
| Time in Market | 47.27% | 39.63% |
| Total Fees | $53.78 | $1,046.70 |
What the Data Shows
The MFI midpoint strategy produced a profit factor of 0.62, meaning 62 cents of gross profit per dollar of gross loss, with a negative Sharpe ratio of -0.47. Its average loss exceeded its average win, and its 16 trades in 12 months were not enough to overcome the fee drag. The 50 midpoint is the problem: MFI crossing 50 fires constantly in a ranging market, and Bitcoin spent most of 2025 and 2026 in a range.
The OBV strategy won only 22.2% of its 36 trades and still made +57.27%, because its average win of $3,006.25 was 4.6 times its average loss of $654.41. That is the classic trend-following payoff shape, and the volume filter is doing the work: OBV crossing its SMA(20) with price above the SMA(50) kept the strategy out of most chop.
The Window Caveat
The honest comparison has a length mismatch, and this article reports it rather than hiding it. The OBV strategy's verified library backtest covers the full 2021-2026 cycle, including the 2021 bull leg where it earned +$3,487.97, the 2022 bear where it lost $4,888, and the 2024 rally where it earned +$8,152. The MFI strategy's verified library backtest covers only August 2025 to August 2026, a 12-month range market.
Two conclusions are safe despite the mismatch. First, the MFI result is what the strategy's verified data shows, and it is negative. Second, the design comparison holds on its own terms: a single-oscillator midpoint rule versus a volume-confirmed trend filter, and the trend filter is the one with a positive edge.
Why the Design Difference Matters
MFI and OBV are not interchangeable volume readings. MFI is bounded, so its signals are always relative to recent extremes, and crossing 50 in a range produces constant whipsaws. OBV is cumulative, so it carries the entire volume history, and its crossovers only happen when volume flow genuinely changes direction.
The backtest shows the consequence. The MFI rule traded 16 times in 12 months and lost. The OBV rule traded 36 times in 5.6 years and won, because it only acted when volume flow and price agreed.
The Practical Lesson
The volume filter beat the volume oscillator on this data. OBV trend +57.27% against MFI midpoint -13.78%
Win rate does not predict the outcome. The losing MFI strategy won 43.8% of trades, the winning OBV strategy only 22.2%
The 50 midpoint is a range-market trap. MFI crossing 50 fires constantly when price is sideways
Windows must be stated exactly. The MFI result is a 12-month verified run, the OBV result is a 5.6-year verified run, and the article reports both as run
The next step is to test MFI with a trend filter, or OBV as a standalone crossover, as its own backtest on CoinQuant. The comparison above is the baseline.
Backtest volume indicators free on CoinQuant
Disclaimer:
Key Takeaway