
How Long Should You Paper Trade a Crypto Strategy Before Going Live?
How long to paper trade crypto strategies before going live? Count trades, not weeks. A strategy that trades once a month needs far longer on paper than one that trades every day, and your own backtest already tells you which kind you have.
The worked example is BTC RSI(14) Mean Reversion 4h, which made 33 trades in 24 months on BTCUSDT 4h bars, about 1.38 a month. At that pace, even 30 forward trades would take close to two years.
This guide shows how to read trade frequency from a backtest, set a target trade count, compare paper results with the backtest and decide when to stop early. The paper trading itself happens elsewhere: CoinQuant is the backtesting step, not a paper trading or execution tool.
How Long to Paper Trade Crypto: Count Trades, Not Weeks
Paper trade until you have enough closed trades to compare with the backtest, not until a date arrives. The length then follows from one division:
- Forward test length in months = target number of trades ÷ trades per month in the backtest.
- Fast strategies that trade several times a week reach a useful count in weeks.
- Slow strategies that trade once or twice a month need well over a year.
For the example strategy, a target of 30 trades at 1.38 trades a month projects to about 21.8 months. That is a projection from the backtest's average rate, not a promise: real signals arrive unevenly.
Why Calendar Time Is the Wrong Unit
"Paper trade for a month" sounds disciplined, but a month means very different things for different strategies. In the example, five of the 24 months had no closed trades at all, and the busiest month had three.
The longest wait between trades was 76 days, from an exit on 2024-10-04 to the next entry on 2024-12-19. A paper test of one month, started on the wrong day, could end with nothing to measure.
Calendar time also hides the market mood. A few weeks usually covers one kind of market, so paper trading duration set in weeks can miss exactly the conditions where a strategy struggles.
Read Trade Frequency From Your Backtest
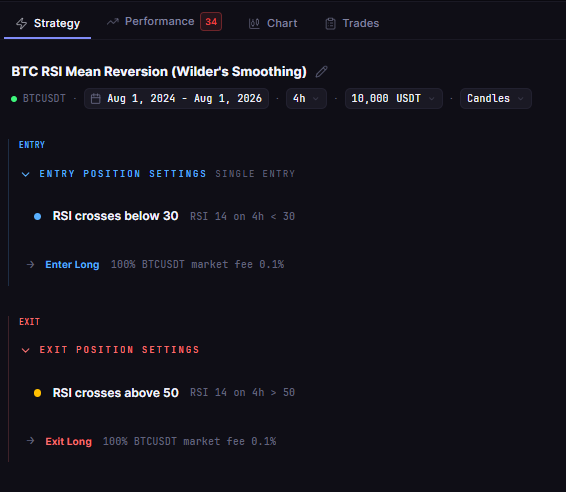
The example is a simple mean reversion rule on Bitcoin. In plain English, as you would type it into CoinQuant:
Buy BTCUSDT on the 4-hour chart when RSI (period 14) crosses below 30. Sell when RSI crosses above 50. Test from August 1, 2024 to August 1, 2026 with $10,000, 100% of equity per trade and a 0.1% fee.
As stored, the entry is RSI(period 14, Wilder's smoothing) crosses below 30 on the 4h timeframe, and the exit is RSI(period 14, Wilder's smoothing) crosses above 50 on the 4h timeframe. In CoinQuant, you write the rule in plain English with no coding required. The platform builds the entry and exit rules and backtests them on historical data.
To turn a backtest into a forward test length, read four things:
- The trade count: 33 round trips in this window.
- The window in months: 2024-08-01 to 2026-08-01, just under 24 months.
- Trades per month: 33 divided by the months gives about 1.38, or 16.5 a year.
- The gaps: months with no trades and the longest wait between trades.
| Metric | Result |
|---|---|
| Strategy | BTC RSI(14) Mean Reversion 4h |
| Window and timeframe | 2024-08-01 to 2026-08-01, 4h |
| Total Trades | 33 (23W / 10L) |
| Trades per month | 1.38 |
| Months with no closed trade | 5 of 24 |
| Longest wait between trades | 76 days |
| Win Rate | 69.70% |
| Total Return | -9.26% |
| Max Drawdown | 31.51% |
| Profit Factor | 0.87 |
| Total Fees | $702.68 |
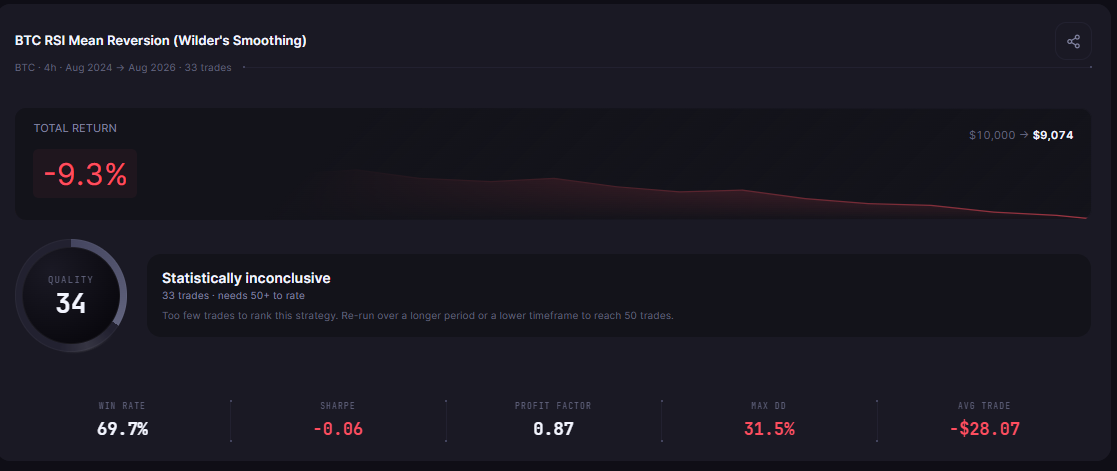
On the Performance tab, the results card marks this run "Statistically inconclusive": 33 trades, and it needs 50+ to rate. The same card shows the trade count next to the window, which is all you need for the calculation above.
Set a Minimum Trade Count for the Forward Test
A sensible floor is 30 closed trades. CoinQuant's guide on how to know if your trading strategy is overfit explains why, writing of Win Rate, Profit Factor and Sharpe Ratio: "Below 30 trades, all of these numbers are dominated by randomness." More is better, and the backtest shows why.
In the backtest, the 10th trade closed on 2025-03-02 (seven months in). The 30th closed on 2026-03-30, about 19.9 months in. Seven of the first 10 trades and 15 of the first 20 closed in profit. Then the largest loss, -16.59% after fees, came on the 28th trade, held from 2026-01-29 to 2026-02-08.
A paper test that stopped after 20 trades would have shown 15 winners and missed that loss entirely. A 50-trade target would take about 36.3 months at the backtest's average rate. That is a projection only: the backtest itself has 33 trades, so 50 trades never happened in this window.
If the forward test length is too long for you, you have three honest options:
- Accept the long test: slow strategies simply need more time.
- Paper trade more markets at once: run the unchanged rule on several pairs, each backtested first.
- Move to a lower timeframe: that creates a new strategy, so backtest it before you paper trade it.
What to Compare Between the Backtest and Paper Results
The point of paper trading is to check that the live behaviour matches the tested behaviour. Compare these items once you reach your trade target:
| What to compare | Backtest reference | Warning sign on paper |
|---|---|---|
| Trade frequency | About 1.38 trades a month | Far more or far fewer signals than the rule should produce |
| Win Rate | 69.70% | A large, lasting gap once you pass 30 trades |
| Average trade | -0.15% after fees | A clearly worse average than the backtest |
| Fills | Market orders in the backtest | Paper fills far from the price on the signal bar |
| Fees | 0.1% on entry and 0.1% on exit | Your venue charges more than the modelled fee |
Do not judge by Win Rate alone. This strategy won 69.70% of its trades and still lost 9.26%, because its average win (+2.52% after fees) was much smaller than its average loss (-6.28%).
Paper trading also has blind spots. Reporting on Binance's planned AI Pro paper trading, Cointribune (6 October 2026) notes that such a simulation "does not always reproduce liquidity, price slippage, or execution speed encountered in real conditions." For where paper trading sits in the full process, see the complete strategy validation cycle, and for the basics, backtesting vs paper trading.
When to Stop Early
Set your stop rules before the paper test starts, using the backtest as the yardstick:
- Deeper drawdown: paper losses beyond the backtest's 31.51% Max Drawdown.
- Bigger single loss: one trade worse than the backtest's worst, -16.59% after fees.
- Longer losing streak: the backtest never lost more than two in a row, so a run of several losses is a flag (with a small sample, a flag rather than proof).
- Signals that do not match: trades the rule should not take, or silence far longer than the 76-day gap.
- Costs above the model: fees or slippage well above 0.1% per side.
Common mistakes
- Setting a date instead of a count: a month can hold zero trades.
- Changing the rules partway through: that restarts the test with a new strategy.
- Stopping early because it looks good: the example's worst loss came late.
- Paper trading without fees: the backtest charged 0.1% on every fill, so your paper record should too.
Once paper results match the backtest, paper trading vs backtesting explains why both still belong in your process before real money.
The Practical Lesson
- Count trades, not weeks: divide your trade target by the backtest's trades per month.
- Use 30 trades as a floor: at 1.38 trades a month, that is roughly 21.8 months for the example.
- Expect late surprises: the example's largest loss came on trade 28.
- Stop by rule: set drawdown, single loss and signal checks from the backtest before you start.
CoinQuant, an AI trading platform, gives you the trade count, window and Win Rate you need to plan the paper test, before you risk anything. It does not paper trade or execute trades, so run the forward test on the venue you plan to use.
Build trading strategies on real data. No coding required.
Frequently Asked Questions
How long should I paper trade crypto before using real money?
Long enough to collect at least 30 closed trades, however many weeks that takes. Divide 30 by your backtest's trades per month: for the example strategy, at 1.38 trades a month, that projects to about 21.8 months.
How many trades should I paper trade before going live?
Aim for at least 30 trades and more if you can. In the example, 15 of the first 20 trades were winners, and the largest loss only arrived on trade 28.
Is paper trading enough after a good backtest?
It is a useful check, not a guarantee. Paper trading may not reproduce real liquidity, slippage or execution speed, so start small when you do go live and keep comparing results with the backtest.
Look beyond returns. Explore your strategy’s drawdowns, risk metrics and trade history with CoinQuant. Analyze your strategy
Disclaimer:
Key Takeaway