
Best RSI Settings for Crypto Mean Reversion: 5 Parameter Sets Backtested on XRP
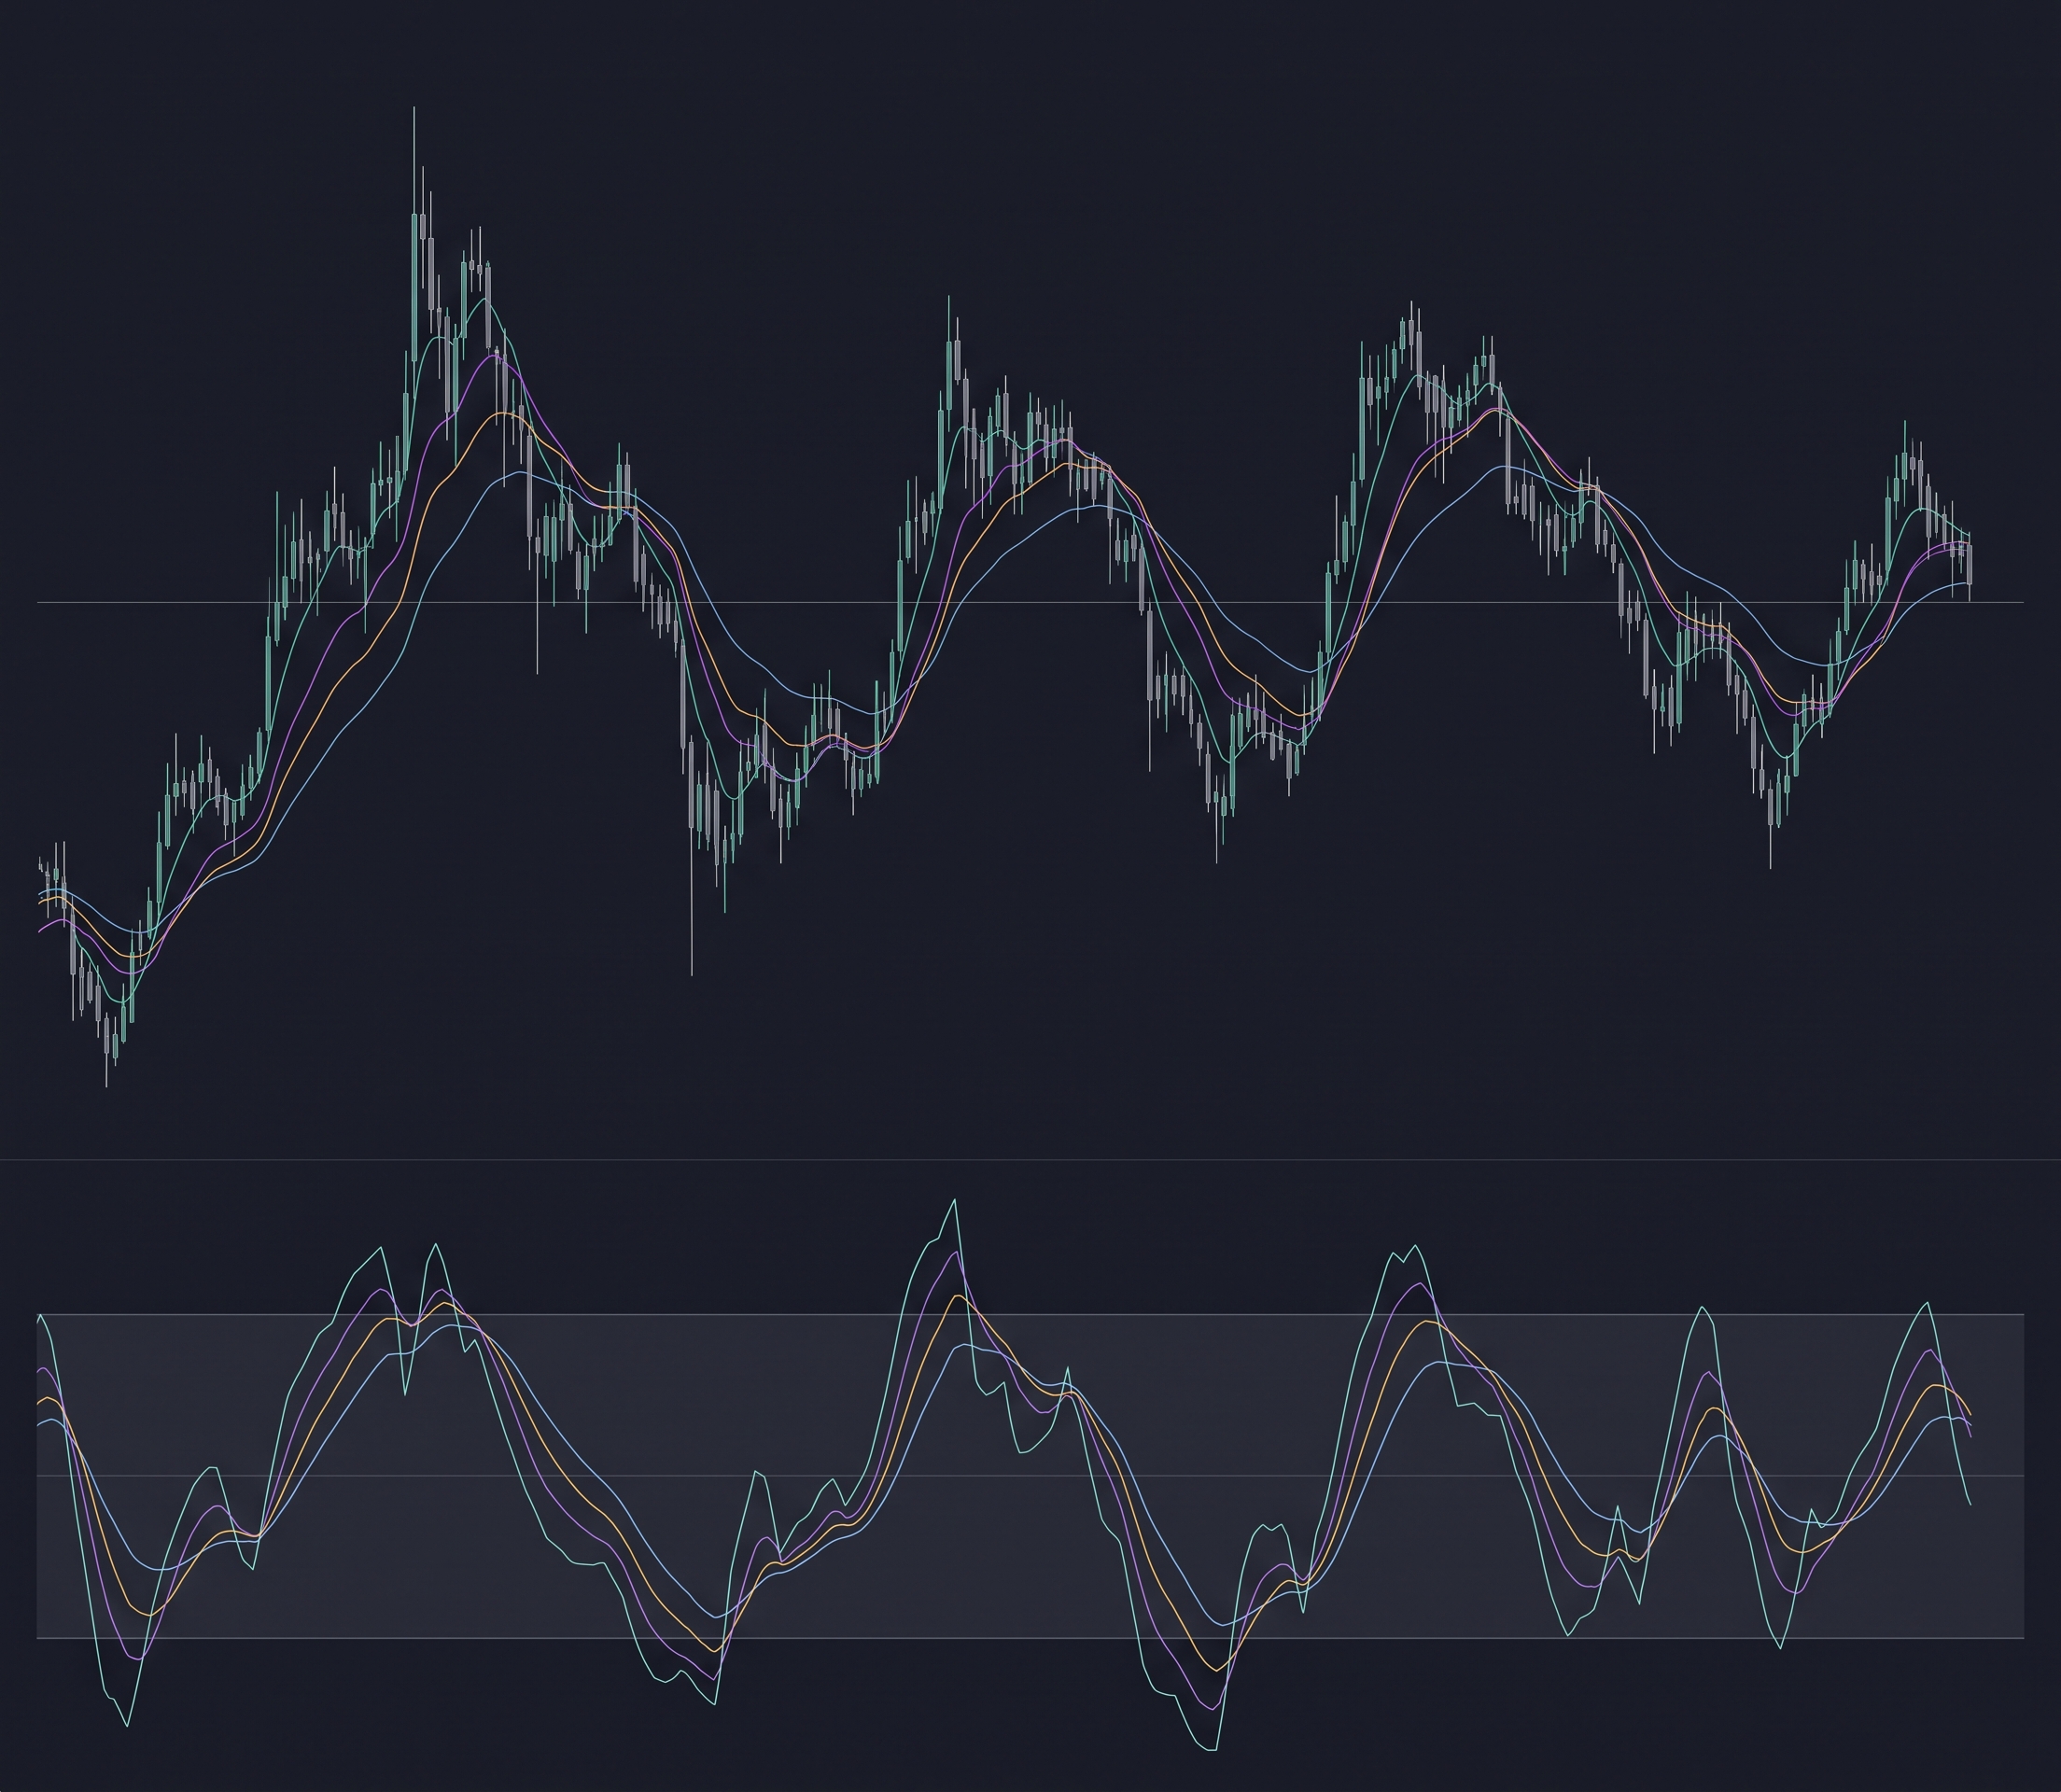
The Relative Strength Index is the most used mean reversion indicator in crypto, and the most argued over. RSI below 30 is oversold. Everyone agrees on that much. Everything after it, the entry threshold, the exit threshold, whether to add a stop or a target, is contested, and most of the contest happens without data. The search for the best RSI settings for mean reversion usually ends in forum threads, not backtests.
This article settles the argument for one asset and one timeframe with actual backtests. Five variants of the same RSI(14) mean reversion family were tested on XRP, four-hour timeframe, over a 12-month window ending August 2026, on CoinQuant. All results include fees and slippage. One setting clearly wins, and one surprising result explains why.
What the RSI Mean Reversion Strategy Does
RSI(14) measures the speed and magnitude of recent price changes on a 0 to 100 scale. Below 30 is conventionally oversold, above 70 overbought. A mean reversion strategy buys weakness: it enters when RSI is low and exits when price recovers.
The base variant is the classic configuration:
Entry: long when RSI(14) crosses below 30
Exit: long when RSI(14) crosses above 55
Four variants change one parameter each, so every result is attributable to a single change:
v2: exit raised to RSI 60
v3: entry tightened to RSI 25, exit raised to RSI 65
v4: entry 30, exit 55, plus a 5% stop loss
v5: entry 30, exit 55, plus an 8% take profit
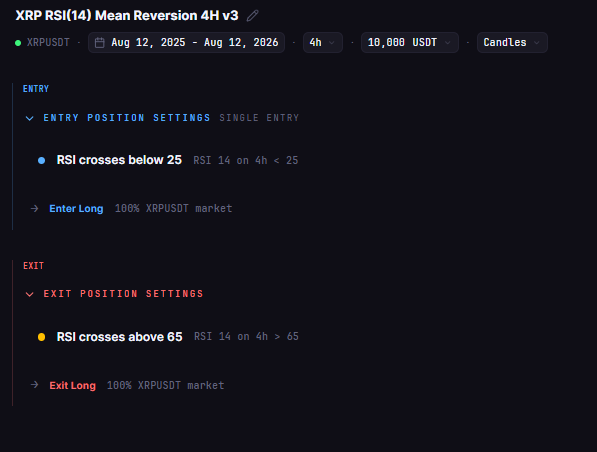
Test Setup
| Parameter | Setting |
|---|---|
| Instrument | XRPUSDT (Binance spot) |
| Timeframe | 4H |
| Period | Aug 12 2025 to Aug 12 2026 |
| Indicator | RSI, 14-period, on all five variants |
| Fees | 0.1% taker (Binance standard) |
| Initial capital | $10,000 |
| Position size | 100% of equity per entry |
| Data Source | Kaiko via CoinQuant |
The Results: One Clear Winner
Five parameter sets, one question: which RSI settings for mean reversion actually make money on XRP? The answer is a single variant.
| Variant | Settings | Total Return | Trades | Win Rate | Profit Factor | Sharpe | Max DD |
|---|---|---|---|---|---|---|---|
| v1 (base) | Entry 30, exit 55 | -5.33% | 18 | 66.7% | 0.87 | 0.06 | 32.7% |
| v2 | Entry 30, exit 60 | -0.49% | 16 | 56.3% | 0.99 | 0.21 | 37.7% |
| v3 | Entry 25, exit 65 | +10.79% | 7 | 71.4% | 1.31 | 0.46 | 34.6% |
| v4 | Entry 30, exit 55, 5% SL | -19.20% | 25 | 44.0% | 0.70 | -0.61 | 33.7% |
| v5 | Entry 30, exit 55, 8% TP | -6.77% | 18 | 66.7% | 0.84 | 0.02 | 32.7% |
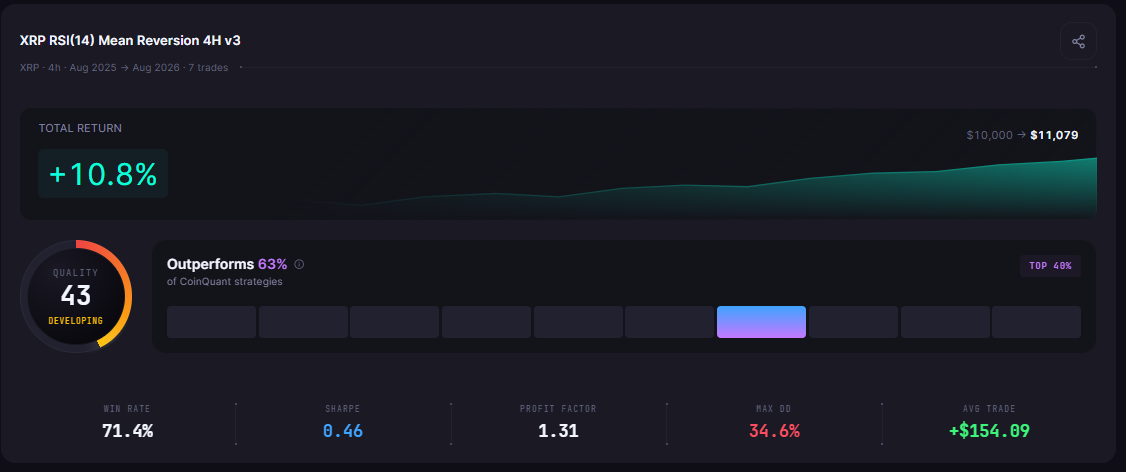
v3 (entry 25, exit 65) is the only profitable variant: +10.79% on seven trades, with a 71.4% win rate, a Profit Factor of 1.31, and a Sharpe of 0.46. $10,000 became $11,079.
The other four variants all lost money, including the widely used base settings. That spread, one winner out of five, is the real finding: RSI mean reversion on XRP is not a fixed recipe. It is a parameter problem, and the parameters decide everything.
Why v3 Wins: Patience and Room to Recover
v3 changes two things at once, and both push in the same direction.
Tightening the entry from RSI 30 to RSI 25 means the strategy only buys deeper oversold conditions. Fewer signals fire (seven trades versus 18 for the base), but the ones that fire happen when XRP is genuinely stretched. Raising the exit from 55 to 65 gives each trade more room to complete the recovery before the position is closed.
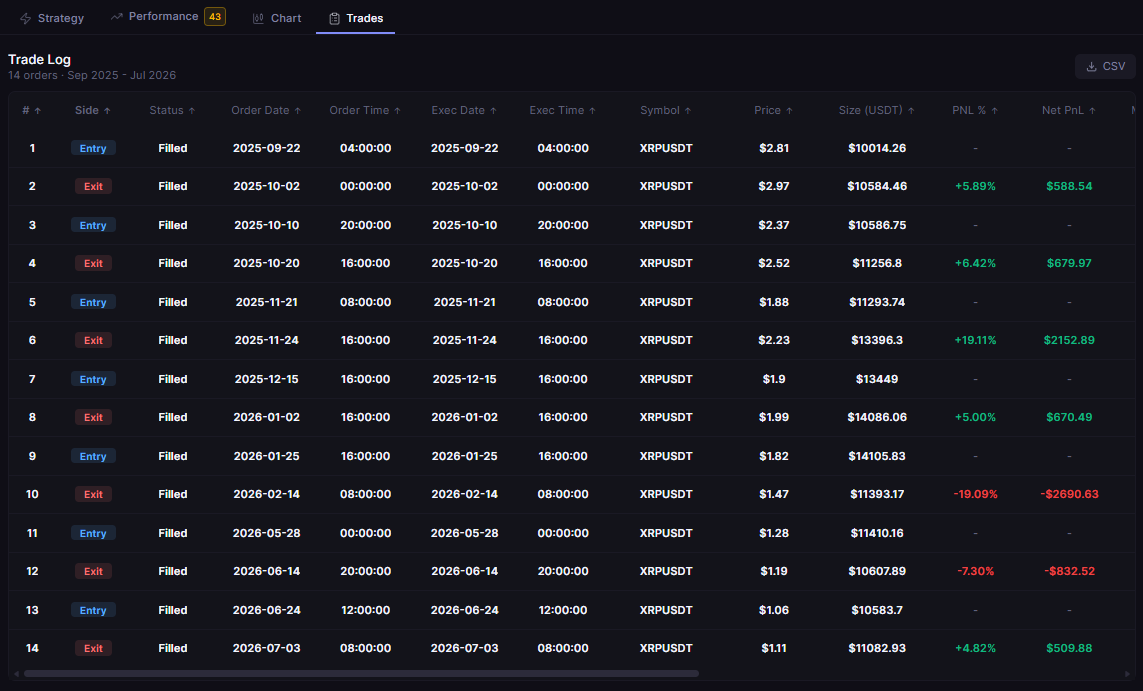
The combination shows up in the trade math. v3's average win of $920.35 against an average loss of $1,761.58 looks harsh at first, but with five winners out of seven trades the wins compound: the best single trade added $2,152.89, and the strategy only lost money on two of seven entries. A high win rate with a large best trade is the mean reversion profile that actually works in a ranging asset.
What the Losers Teach
Each losing variant carries a lesson:
v1 (base, entry 30 exit 55) lost 5.33% despite a 66.7% win rate. The exit at 55 closed winners too early while losing trades ran their course. High win rate, negative return: the classic signal that the exit, not the entry, is the problem.
v2 (exit 60) nearly broke even at -0.49%. Raising the exit recovered most of the damage, confirming the exit threshold is the sensitive parameter. But 56.3% win rate with a Profit Factor of 0.99 is a coin flip with fees attached.
v4 (5% stop loss) is the cautionary tale at -19.20%. Adding the stop did not protect the strategy, it sabotaged it. The stop converted what would have been recovering trades into locked losses, cut the win rate to 44.0%, and raised the trade count from 18 to 25. On XRP's 4H swings, a 5% stop sits inside normal noise, which is why it triggered so often. The most "protective" variant was the worst performer.
v5 (8% take profit) lost 6.77%. The take profit capped the strategy's best trade, the one source of outsized gains, and the capped version could not overcome its fees.
The Buy-and-Hold Context: Why v3's Win Matters More Than It Looks
The parameter comparison above is only half the story. The other half is what XRP did during the same window: buy-and-hold XRP turned $10,000 into $3,250, a decline of roughly two thirds.
| Approach | Final Balance | vs Buy-and-Hold XRP |
|---|---|---|
| v3 (entry 25 exit 65) | $11,079 | +$7,829 |
| v2 (exit 60) | $9,951 | +$6,701 |
| v1 (base) | $9,467 | +$6,216 |
| v5 (TP8) | $9,323 | +$6,073 |
| v4 (SL5) | $8,080 | +$4,830 |
| Buy and hold XRP | $3,250 | Baseline |
Every single variant beat holding XRP, and the worst variant still finished with nearly two and a half times the buy-and-hold balance. Mean reversion on XRP in this window was not a marginal edge, it was a survival tool: buying oversold dips and selling recoveries kept capital out of the deepest part of the decline.
This context reframes the results. v3 did not just beat four other parameter sets. It made money, +10.79%, in a window where the underlying asset lost two thirds of its value. That is the difference between a curve-fit parameter pick and a strategy with a real behavioral edge in a falling market. It is also the strongest argument for testing RSI settings on the asset you actually trade, before the market decides the settings for you.
The Practical Lesson: Best RSI Settings for Mean Reversion
The tested library family is XRP RSI(14) Mean Reversion 4H, with variants v2 (exit RSI 60), v3 (entry 25 exit 65), v4 (SL5), and v5 (TP8) on CoinQuant. Every variant in this article is in the library, loadable and re-runnable.
Three takeaways transfer to any crypto mean reversion setup:
The exit threshold matters more than the entry. Moving the exit from 55 to 60 recovered most of the base variant's losses; moving it to 65, with a deeper entry, flipped the strategy profitable.
Risk controls need their own backtest. The 5% stop loss was the worst variant in the study. A stop that fits your risk tolerance but sits inside normal market noise is not protection, it is a fee generator.
Small trade counts demand humility. v3's seven trades is a small sample. The result is encouraging, not proven, and the correct next step is a longer window and out-of-sample testing.
Backtesting five RSI settings took minutes and cost nothing in live capital. That is the point: on XRP in 2026, the difference between the best and worst RSI setting was 30 percentage points of total return, and the data was available before a single order was placed. The wider picture of XRP's range behavior sits in our XRP range-market backtest, and the mean reversion versus trend comparison shows when this style of strategy earns its keep.
Disclaimer:
Key Takeaway
