
XRP Trading Strategy Backtested for Range Markets: What the 2026 Data Shows

XRP has spent much of 2026 trading between defined support and resistance levels, making it a candidate for mean reversion strategies rather than trend-following approaches. When an asset oscillates within a range rather than trending directionally, the strategic edge shifts from catching breakouts to buying oversold conditions and exiting near equilibrium.
This article backtests an RSI-based mean reversion strategy on XRP across multiple variants and timeframes, using CoinQuant data from August 3, 2025 to August 3, 2026. Fees and slippage are included. The story involves a specific iteration path, a genuinely positive-returning configuration, and an important caveat about sample size that every reader needs to understand before acting on the numbers.
What the RSI Mean Reversion Strategy Does
The Relative Strength Index measures the speed and magnitude of recent price changes, scaled from 0 to 100. Readings below 30 conventionally indicate oversold conditions. A mean reversion strategy inverts the typical momentum approach: it buys weakness rather than strength.
The baseline strategy rules for "XRP RSI(14) Mean Reversion 4H":
Entry: Long when RSI(14) crosses below 30 (XRP is oversold)
Exit: Long when RSI(14) crosses above 55
The 14-period RSI is the standard setting. The exit at 55 is a conservative target: the strategy does not wait for XRP to become overbought before exiting. It closes the position once RSI reaches a neutral-to-moderately-bullish reading, locking in gains from the oversold recovery without holding for a continuation move. Four variants of this strategy were also tested to find whether threshold adjustments could improve the result.
Test Setup
| Parameter | Value |
|---|---|
| Asset | XRPUSDT (Binance Spot) |
| Indicator | RSI, 14-period |
| Timeframes Tested | Four-Hour (4H), Daily (1D) |
| Test Window | August 3, 2025 to August 3, 2026 |
| Fees and Slippage | Included |
| Data Source | Kaiko via CoinQuant |
The Baseline: Four-Hour Timeframe
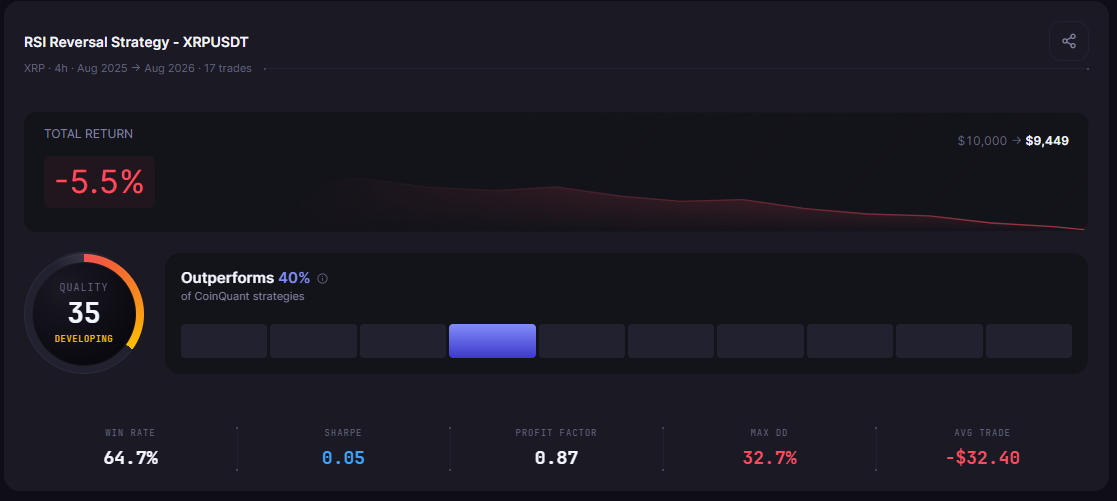
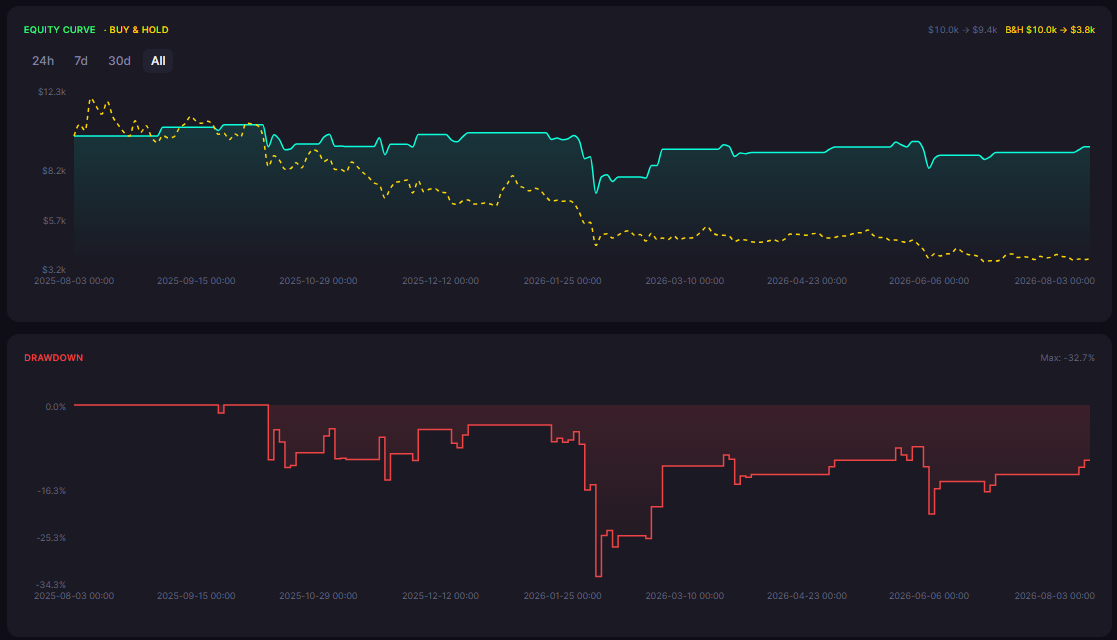
The baseline four-hour strategy, "XRP RSI(14) Mean Reversion 4H," produced 17 trades over the 12-month window with a win rate of 64.7% and a total return of -5.5%. The maximum drawdown reached 32.7%.
The win rate of 64.7% is the first signal that this strategy has a genuine edge: nearly two in three trades were winners. The -5.5% total return despite the high win rate indicates that losing trades were, on average, larger than winning trades. The 32.7% maximum drawdown confirms periods where XRP moved significantly further against the position before RSI recovered enough to reach the exit level.
The baseline is close to breakeven and shows clear potential. The iteration that follows was designed to find whether a threshold adjustment could push the total return into positive territory.
The Iteration Path: Five Variants Tested
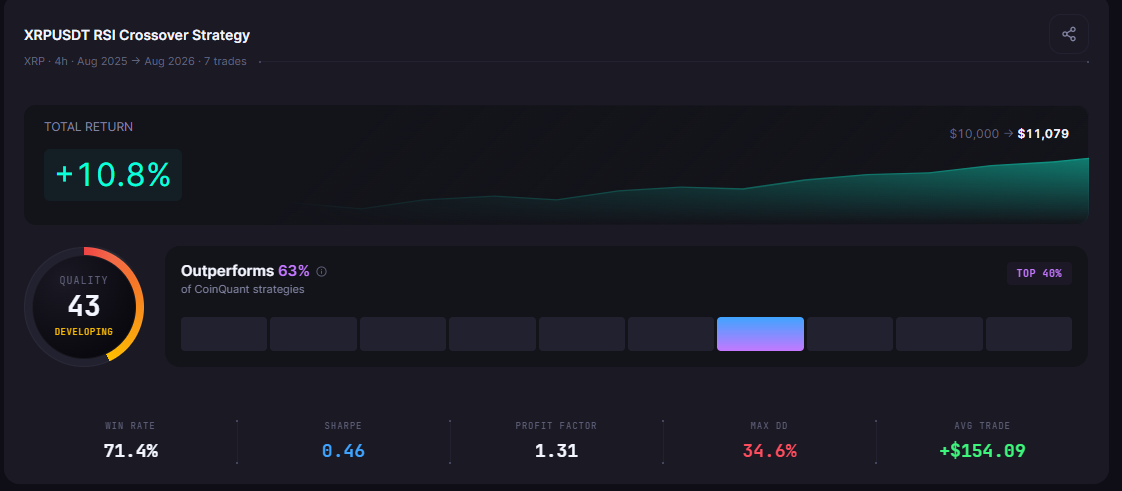
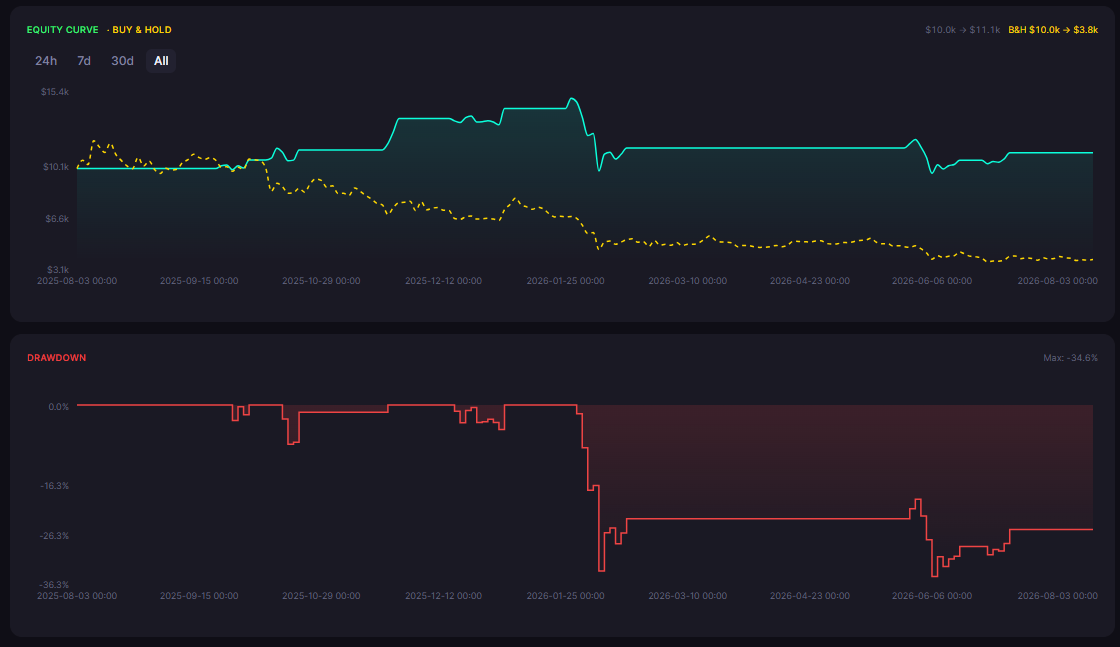
Four parameter variants were tested against the baseline. The table below shows the full iteration path:
| Strategy | Total Return | Total Trades | Win Rate | Max Drawdown |
|---|---|---|---|---|
| XRP RSI(14) Mean Reversion 4H (baseline) | -5.5% | 17 | 64.7% | 32.7% |
| XRP RSI(14) Mean Reversion 4H v2 (exit RSI 60) | +5.1% | 16 | 62.5% | 37.7% |
| XRP RSI(14) Mean Reversion 4H v3 (entry 25 exit 65) | +10.8% | 7 | 71.4% | 34.6% |
| XRP RSI(14) Mean Reversion 4H v4 (SL5) | -19.4% | 24 | 41.7% | 33.7% |
| XRP RSI(14) Mean Reversion 4H v5 (TP8) | -6.9% | 17 | 64.7% | 32.7% |
v2: Raise the exit to RSI 60. Keeping the same entry (RSI below 30) but raising the exit from 55 to 60 gave the winning trades more room to develop. The result was +5.1% on 16 trades with a 62.5% win rate and a maximum drawdown of 37.7%. The higher exit threshold allowed profitable trades to run slightly longer, improving the win/loss ratio enough to turn the total return positive.
v3: Tighten entry to RSI 25, raise exit to RSI 65. This is the recommended variant. By tightening the entry condition from RSI below 30 to RSI below 25, the strategy only enters when XRP is in a deeper oversold condition. The exit is raised from 55 to 65, requiring a more complete recovery before closing. "XRP RSI(14) Mean Reversion 4H v3 (entry 25 exit 65)" produced +10.8% on seven trades with a win rate of 71.4% and a maximum drawdown of 34.6%.
v4: Add a 5% stop-loss. Adding a hard stop at 5% loss changed the character of the strategy significantly. The trade count rose to 24 as the stop triggered on trades that would otherwise have recovered, and the win rate fell to 41.7%. Total return was -19.4%. A stop-loss on a mean reversion strategy frequently does more harm than good: it closes positions precisely when the oversold condition is deepest, just before recovery begins.
v5: Add an 8% take-profit. Capping gains at 8% produced -6.9% on 17 trades with a 64.7% win rate. The fixed take-profit occasionally cut off larger recoveries before the RSI reached 55.
Why the v3 Settings Work Better (and the Sample Size Caveat)
The v3 result of +10.8% from seven trades with a 71.4% win rate is the best outcome in the iteration. The logic behind why it works is sound: requiring RSI below 25 before entering means the strategy only acts on the deepest oversold conditions, filtering out the marginal readings near 30 that the baseline was entering on. Requiring recovery to RSI 65 rather than 55 means the winning trades have more room to develop before the position is closed.
The caveat must be stated clearly. Seven trades in 12 months is a very small sample. A win rate of 71.4% across seven trades could reflect genuine edge or it could be the result of a favorable sequence of those seven specific market events. The +10.8% return is real for the backtest window, but the statistical confidence from a sample this small is limited.
The v2 result offers a more statistically meaningful comparison: 16 trades with a +5.1% return and a 62.5% win rate. The positive direction is consistent with v3 and suggests the direction of the improvement is real even if the exact magnitude from v3 is uncertain.
The 1D Timeframe: A Different Story
The daily timeframe produced a sharply different result from the four-hour equivalent.
"XRP RSI(14) Mean Reversion 1D" generated only three trades over the 12-month window, with a win rate of 0.0% and a total return of -25.2%. The maximum drawdown reached 44.1%.
| Strategy | Total Return | Total Trades | Win Rate | Max Drawdown | Sharpe Ratio | Profit Factor |
|---|---|---|---|---|---|---|
| XRP RSI(14) Mean Reversion 1D | -25.2% | 3 | 0.0% | 44.1% | - | - |
| XRP RSI(14) Mean Reversion 4H (baseline) | -5.5% | 17 | 64.7% | 32.7% | 0.05 | 0.87 |
Three trades with zero wins is a sample too small to draw conclusions from, but the direction is clear: the daily timeframe did not find the same edge that the four-hour strategy identified. RSI oversold conditions on the daily chart for XRP were infrequent in this window, and when they appeared, XRP did not recover to the exit level before the position absorbed further loss.
The four-hour timeframe identified XRP's actual mean reversion rhythm during this period more accurately. XRP oscillated within ranges at a speed that the four-hour RSI could detect and trade, while the daily RSI signals were too slow and too infrequent to capture the same dynamics.
The Practical Lesson
The XRP RSI mean reversion backtest provides the clearest example in this week's data of what systematic iteration can find. The baseline strategy was close to breakeven. Two successive adjustments to the thresholds produced positive returns. The data supports the direction of that improvement.
The honest caveat is that the best result, +10.8% from seven trades, comes with statistical limitations. A trader considering this strategy should run additional window tests, including periods with different XRP market conditions, before treating the v3 result as a durable edge rather than a favorable sample.
Three lessons the data supports:
RSI mean reversion on XRP's four-hour chart identified a genuine pattern during the August 2025 to August 2026 range regime.
Tighter entry conditions (RSI below 25 vs below 30) improved selectivity and outcome, at the cost of fewer trades.
A hard stop-loss disrupts mean reversion logic by closing positions at their worst point, before recovery begins. The v4 result confirmed this.
Running additional XRP RSI variants, including multi-year windows, will clarify whether this edge is persistent or specific to the range conditions of the past 12 months.
Disclaimer:
Key Takeaway
