
Best Crypto Trading Strategy in 2026: Backtested and Ranked

"Which is the best crypto trading strategy 2026 has to offer?" is the most asked strategy question of the year, and most answers are opinions. This article replaces opinion with a head-to-head backtest: five strategy families, identical assumptions, same asset, same window, all ranked on real results.
Every strategy below ran on CoinQuant on BTCUSDT daily candles from January 2021 to August 2026, with Binance standard taker fees (0.1%) included in every result and no leverage. The window covers the 2021 bull market, the 2022 crash, the 2023 recovery, and the 2024-2026 cycle, so the ranking reflects full market regimes, not a lucky stretch. All five strategies are in the public CoinQuant Strategy Library, so any reader can open them and re-run the backtests.
Test Setup: Five Families, Identical Conditions
Each strategy family represents a different market theory. The rules are deliberately standard so the comparison tests the family, not a tuned variant.
| Strategy (library name) | Family | Entry rule | Exit rule |
|---|---|---|---|
| BTC Breakout 1D 2021-2026 | Breakout | Close above highest high of prior 20 bars | Close below lowest low of prior 20 bars |
| BTC Trend Following 1D 2021-2026 | Trend following | Close crosses above SMA(200) | Close crosses below SMA(200) |
| BTC EMA Crossover 20/50 1D 2021-2026 | Trend following | EMA(20) crosses above EMA(50) | EMA(20) crosses below EMA(50) |
| BTC Mean Reversion 1D 2021-2026 | Mean reversion | RSI(14) crosses below 30 | RSI(14) crosses above 50 |
| BTC Bollinger Mean Reversion 1D 2021-2026 | Mean reversion | Close crosses below lower Bollinger band (20, 2.0) | Close crosses above middle band |
All five use BTCUSDT spot on Binance, daily candles, $10,000 initial capital, 100% position size, one position at a time, long only, no leverage. Fees are the same 0.1% taker rate for every trade.
Best Crypto Trading Strategy 2026: The Results, Ranked
| Rank | Strategy | Total Return | Trades | Win Rate | Profit Factor | Sharpe | Max DD |
|---|---|---|---|---|---|---|---|
| 1 | BTC Breakout 1D 2021-2026 | +118.4% | 24 | 50.0% | 1.45 | 0.54 | 48.6% |
| 2 | BTC Trend Following 1D 2021-2026 | +82.8% | 25 | 20.0% | 2.02 | 0.49 | 37.6% |
| 3 | BTC EMA Crossover 20/50 1D 2021-2026 | +79.2% | 16 | 37.5% | 1.55 | 0.48 | 51.6% |
| 4 | BTC Mean Reversion 1D 2021-2026 | +39.3% | 14 | 57.1% | 2.12 | 0.35 | 24.6% |
| 5 | BTC Bollinger Mean Reversion 1D 2021-2026 | +10.4% | 35 | 65.7% | 1.07 | 0.22 | 52.7% |
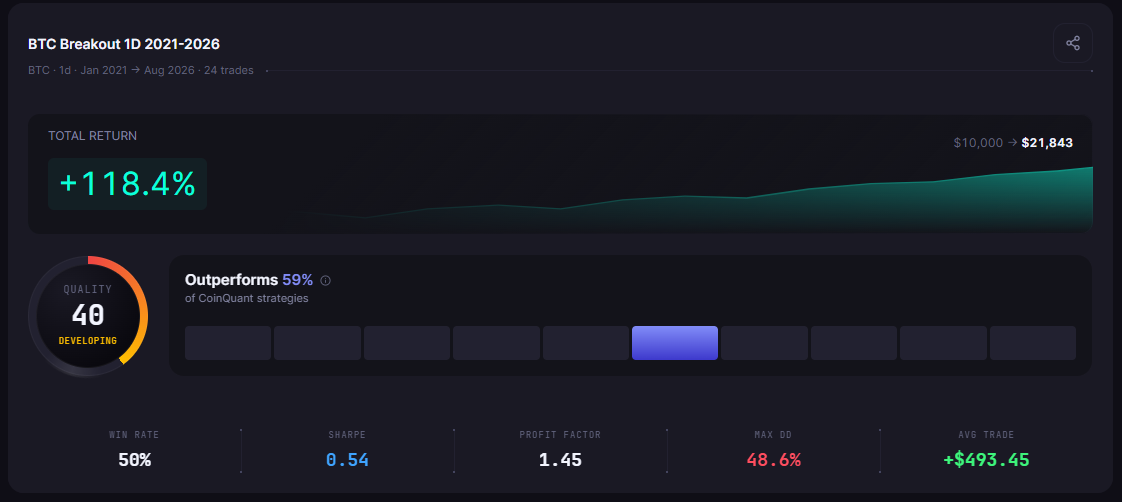
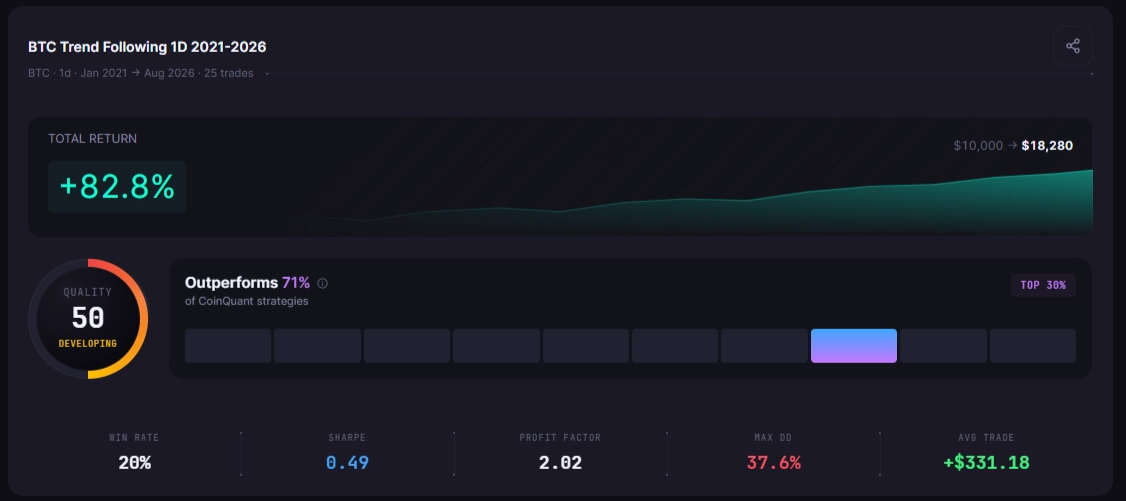
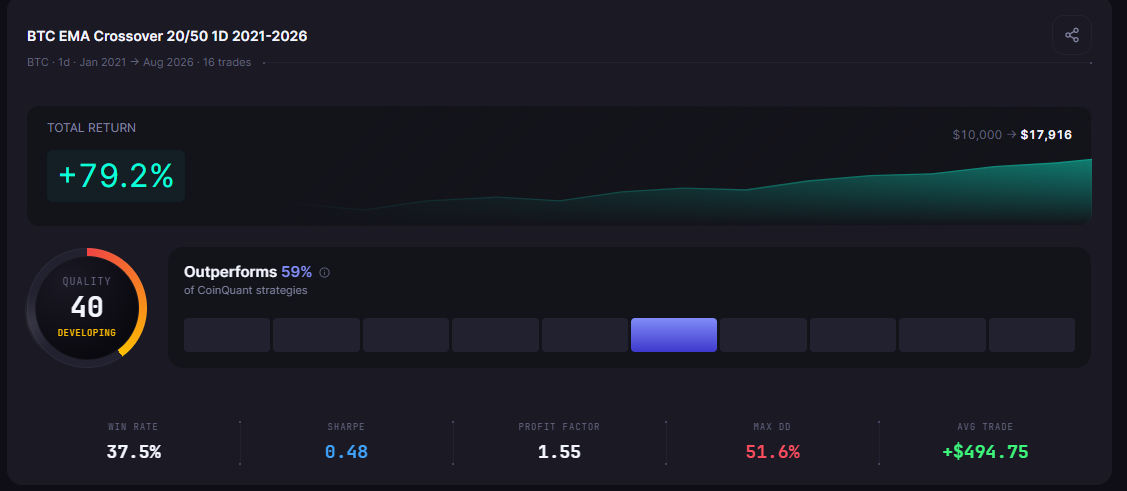
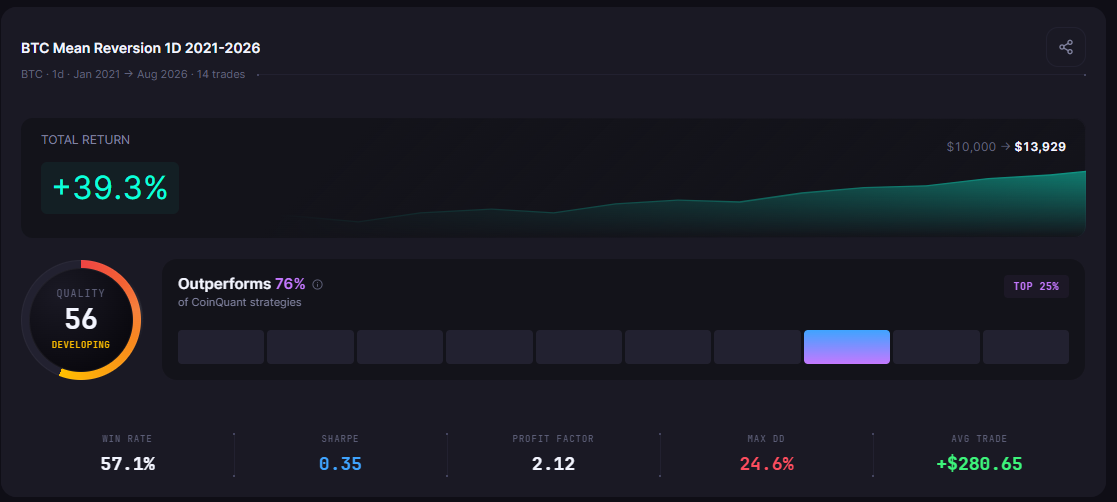
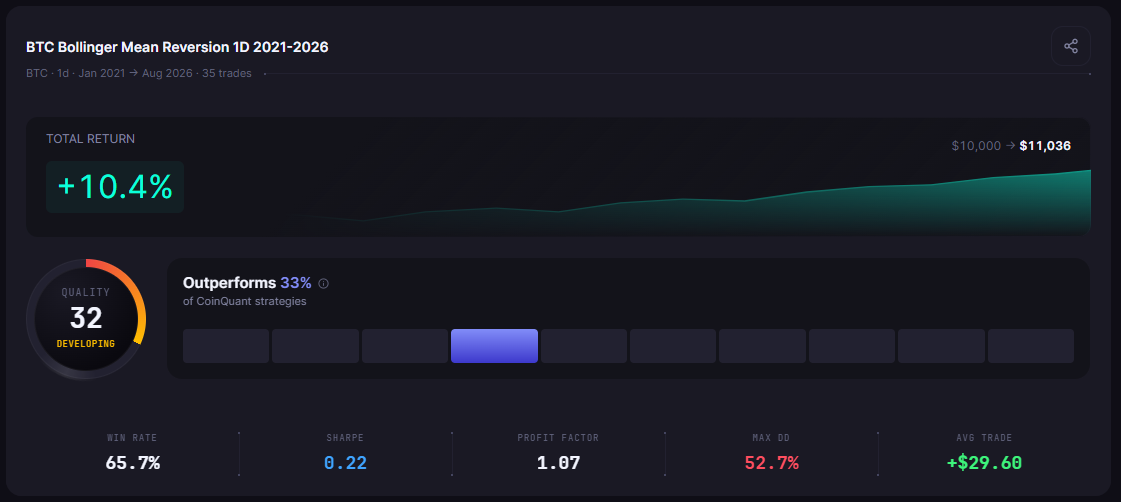
Every strategy ended the period profitable. That is not a given for daily Bitcoin rules in a window that includes a severe bear market, and it is worth pausing on: four of five families produced a profit factor above 1.45, meaning the edge is real at the family level.
The Winner: Breakout, by a Narrow Margin
BTC Breakout 1D 2021-2026 tops the ranking with a +118.4% total return ($10,000 to $21,843), the best Sharpe ratio in the field (0.54), and a 50% win rate. Its 24 trades over five and a half years means it sat in cash most of the time and only acted when price broke a 20-bar range.
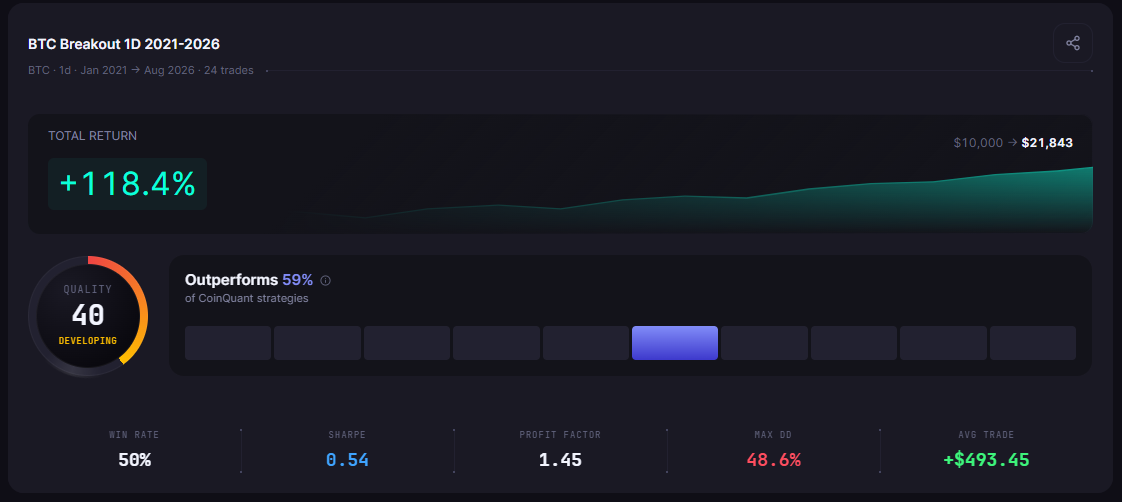
The breakout family wins on Bitcoin because Bitcoin trends. The 2021 rally, the 2023 recovery, and the 2024 cycle all produced sustained moves that a 20-bar breakout caught early and rode. The strategy's single best day added +$15,837, a reminder that breakout edges are concentrated in a handful of days. The cost is a 48.6% max drawdown during the 2022 bear market, when every long breakout got stopped repeatedly.
The Highest-Quality Edge: Trend Following
By profit factor, BTC Trend Following 1D 2021-2026 is the best strategy in the test at 2.02, meaning it made $2.02 of gross profit for every $1.00 lost. Its win rate is only 20%, the classic trend-following profile: lose small many times, win big rarely.
Two details matter:
Best trade +$8,317 on a Thursday, versus a worst trade of -$2,493
Max drawdown 37.6%, the second shallowest in the field
Total fees $654.79 for the whole five-year window, the lowest of the three trend strategies
Trend following with a 200-day filter spent most of the window in cash, exactly like the breakout strategy. Both are patient approaches, and patience was rewarded.
The Smoothest Ride: RSI Mean Reversion
BTC Mean Reversion 1D 2021-2026 ranks fourth on return but first on comfort: 57.1% win rate, profit factor 2.12 (the best in the test), and a 24.6% max drawdown (by far the shallowest). It also produced a 7-trade consecutive win streak, the longest of any strategy here.
The tradeoff is visible in the numbers. The strategy's average hold is short and its wins are smaller, so it compounds slower: +39.3% versus +118.4% for breakout. For a trader who cannot sit through a 48% drawdown, the RSI reversion profile is arguably the better fit even though it ranks fourth on raw return.
What Did Not Work: Bollinger Mean Reversion
BTC Bollinger Mean Reversion 1D 2021-2026 has the highest win rate in the test (65.7%) and the worst result (+10.4%). The profit factor of 1.07 explains why: wins are frequent but tiny, losses are occasional but large, and the 52.7% max drawdown means the strategy gave back almost everything during the 2022 decline.
This is the single most instructive row in the table. A high win rate can coexist with a barely profitable strategy, which is why the ranking leans on profit factor and Sharpe alongside total return. It is also the answer to the most common beginner question about this test: why not just pick the strategy with the highest win rate? Because the highest win rate produced the lowest return, and the strategy with the second-lowest win rate produced the second-highest return. Win rate measures how often you are right; profit factor measures how much it pays when you are.
Best Strategy vs Simply Holding Bitcoin
Bitcoin itself rose substantially over the same window, and buy and hold won the period on raw return.
| Approach | Time in Market | Result |
|---|---|---|
| BTC Breakout 1D 2021-2026 | Selective (24 trades in 5.5 years) | +118.4%, 48.6% max DD |
| Buy and hold Bitcoin | 100% | Higher absolute return, full exposure through every crash |
The ranking is therefore not a claim that a strategy beats holding Bitcoin in every window. It is a claim about the risk experience: the best strategies here captured most of the upside while holding a position only a fraction of the time, and each one's drawdown is on the table before you risk a dollar. That is the honest framing, and it is the one the bot platforms ranking "best strategies" never publish, because they do not run the numbers. For the popularity view on the same question, see the most popular crypto trading strategy of 2026, backtested, and for the deeper family comparison, mean reversion vs trend following has the full head-to-head.
The Practical Takeaway
Best total return: breakout, +118.4%
Best risk-adjusted edge: trend following, profit factor 2.02, Sharpe 0.49
Best drawdown profile: RSI mean reversion, 24.6% max drawdown
Best lesson: win rate alone misleads; Bollinger reversion won 65.7% of trades and still nearly flatlined
The best crypto trading strategy in 2026 depends on which cost you can afford: drawdown or patience. Breakout and trend following demand the patience to sit in cash for months; mean reversion demands the nerve to buy when price is falling. What no trader should do is pick any of these from a list without running the backtest on the exact rules, because the numbers above are reproducible, and the next step is to reproduce them and test your own variations.
Disclaimer:
Key Takeaway
