
Backtest Results
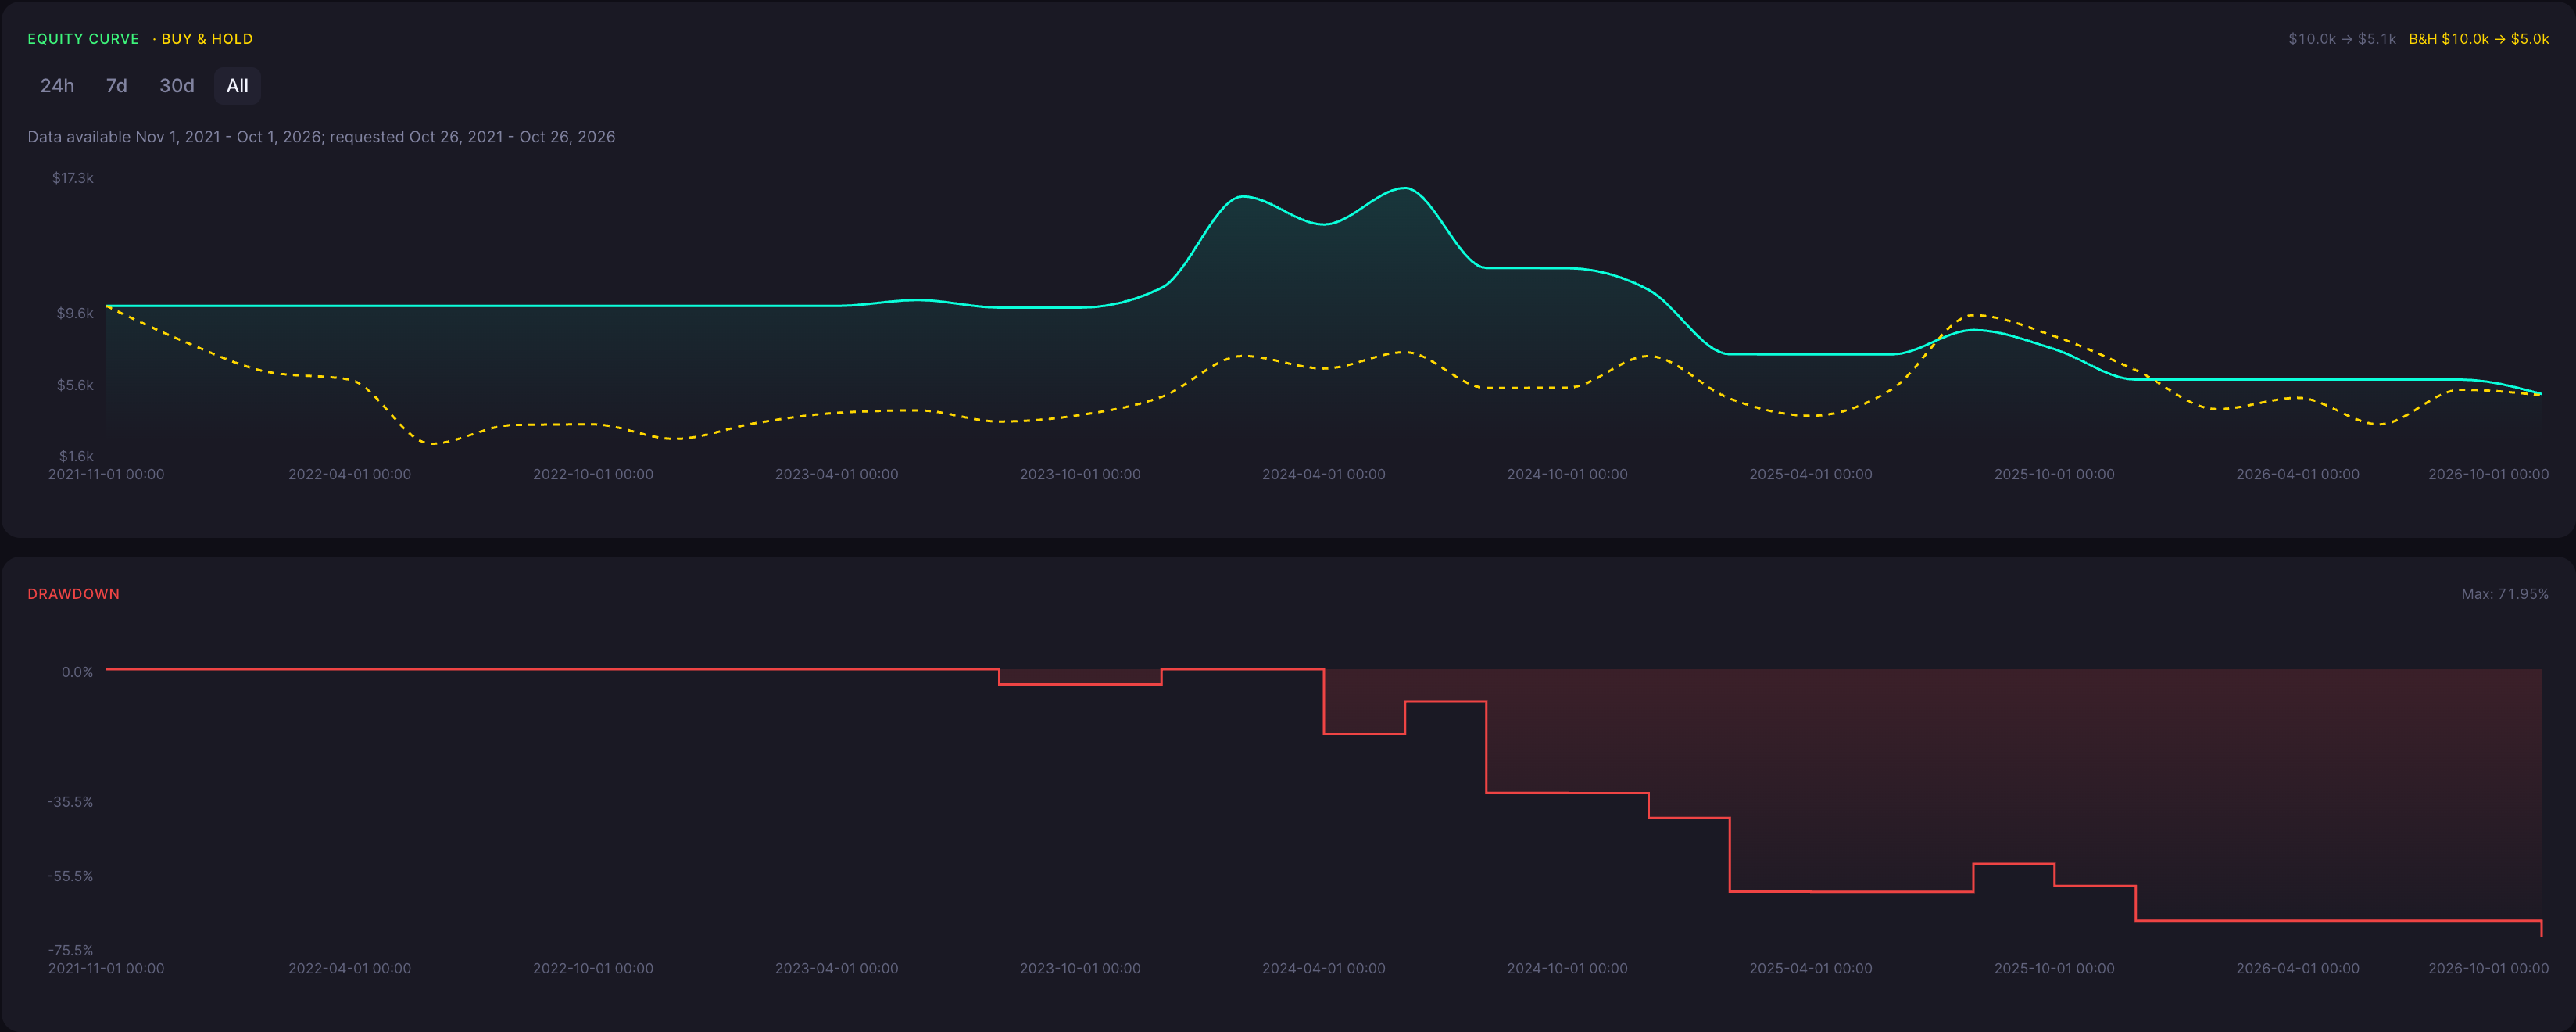
The strategy lost money, recording a total return of -49.10% from starting capital of 10,000.00 USDT. Maximum drawdown was 71.95%. Across 5 trades, the win rate was 20.00%. A negative return and a small sample provide no basis for claiming a dependable advantage.
ROI
-49.10%
Win Rate
20.00%
Max DD
71.95%
Sharpe
-0.21
Profit Factor
0.31
Total Trades
5
Backtest insights
This run ended with a loss of capital, reflected in its total return of -49.10%. The maximum drawdown of 71.95% was deeper than the final decline, showing why endpoint return and the path of equity need separate attention. A win rate of 20.00% and profit factor of 0.31 add context to the losing result. With only 5 trades, however, these figures do not establish how the rule behaves across a broad range of conditions. The Sharpe ratio of -0.21 is descriptive, not a forecast.

Performance may vary depending on market conditions. During trending periods, the strategy may behave differently compared to ranging markets, impacting both returns and drawdowns.
How the RMA Strategy Works
What It Is
The Running Moving Average is commonly associated with Wilder's smoothing. It updates a prior average gradually as new closing prices arrive, producing a slower response than a standard EMA of the same length. This strategy uses a 10-period RMA of Close as a trend reference, not as a price prediction.
How Signals Are Generated
A cross of Close above the 10-period Running Moving Average opens a long ETHUSDT position. A cross below closes it. The saved timeframe is monthly. The rule does not add short positions, discretionary filters or a separate profit target to those entry and exit conditions.
When It Works Best
In general, a heavily smoothed average can suit persistent trends by avoiding some minor fluctuations. That general characteristic does not show that the rule will be profitable or explain the outcome of this particular run.
When It Performs Poorly
Slow smoothing can leave an entry late or an exit well after a reversal. Repeated price crossings in a range can also generate losses. Monthly decisions do not prevent large interim changes in equity.
Strengths

Heavy smoothing provides a clear longer-term trend reference.
The entry and exit use the same explicit crossover logic.
The configuration records its capital, sizing and exact saved identities.
Limitations

This completed run lost capital rather than demonstrating profitability.
Slow responses can leave substantial exposure during reversals.
Few trades and a clipped window limit broader conclusions.
Why Use CoinQuant Instead of Manual Trading or Other Platforms
Choosing the right way to test and execute trading strategies is critical. Below is a comparison between CoinQuant, manual trading, and other platforms to highlight key differences in speed, accuracy, and usability.
CoinQuant is designed specifically for traders who want to validate strategies quickly and reliably without coding. Unlike manual trading or traditional platforms, it allows you to test multiple scenarios, analyze performance instantly, and iterate faster using real data.
Frequently asked questions
Was the monthly ETH RMA backtest profitable?
No. Its total return was -49.10%, representing a loss over the available test dates of 1 Nov 2021 to 1 Oct 2026. The starting capital was 10,000.00 USDT.
What was the largest equity decline?
Maximum drawdown was 71.95%. That is a peak-to-trough account-equity decline, distinct from the negative final return.
How much trading evidence supports these numbers?
The run recorded 5 trades with a win rate of 20.00%. That small sample is not enough for firm conclusions about future behavior.
What do the Sharpe ratio and profit factor show?
Sharpe ratio was -0.21 and profit factor was 0.31. Both describe the same losing historical run and should be read together with return and drawdown.
Is its window identical to the three-month RMA page?
No. This page uses the saved monthly configuration's own test dates, 1 Nov 2021 to 1 Oct 2026, which are shorter than originally planned because of limited market data. Comparing returns without aligning those windows would be misleading.