Live Backtest Results
This backtest analyzes the performance of the Moving Average (9/21) strategy on ETH/USDT over the 2 Week timeframe using historical market data. The results provide insight into how the strategy would have performed under real market conditions, including profitability, risk exposure, and consistency.
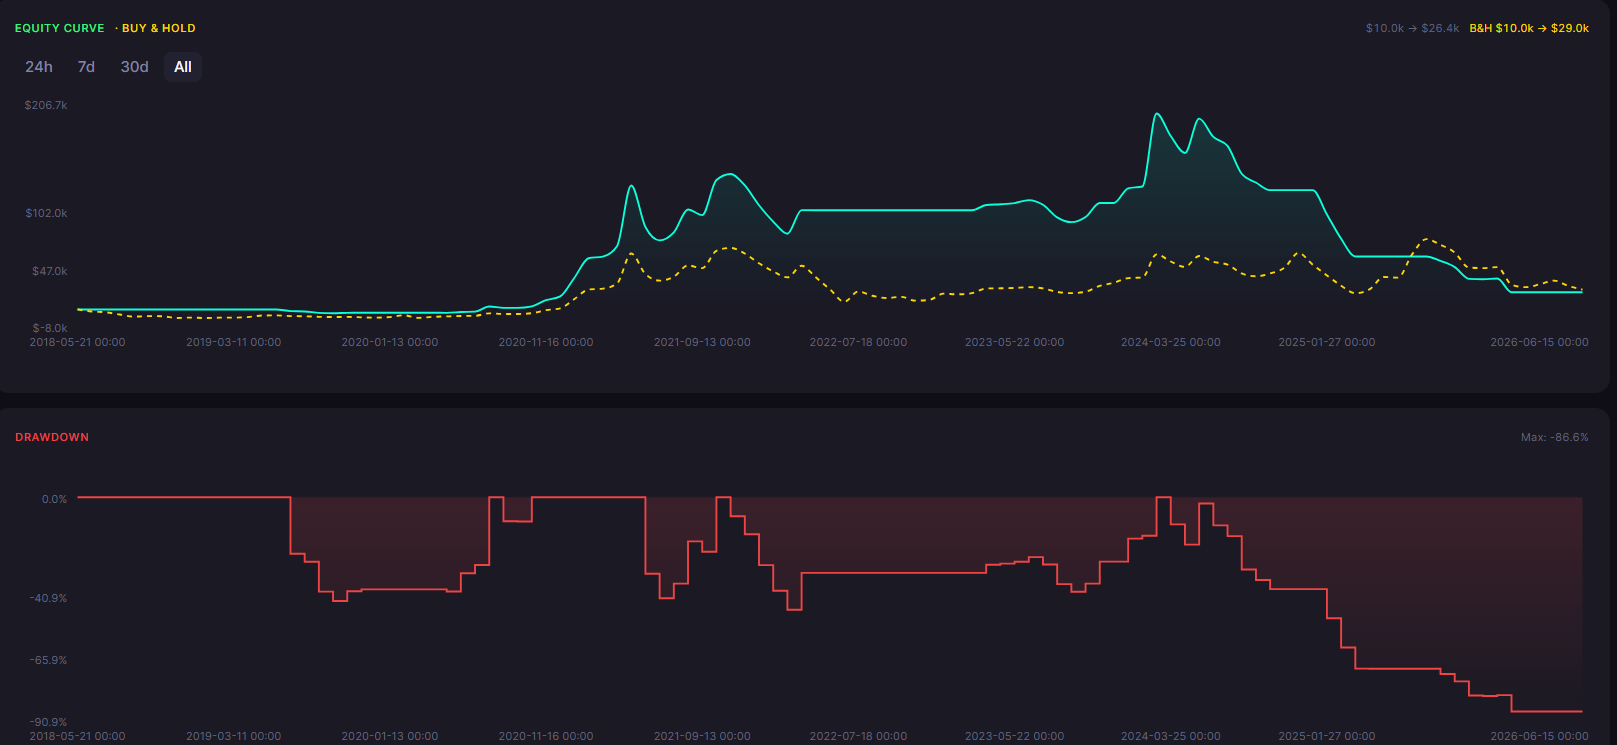
ROI
164.68%
Win Rate
50.0%
Max DD
86.57%
Sharpe
0.49
Profit Factor
1.16
Total Trades
6
Backtest insights
The Moving Average (9/21) strategy generated a total return of 164.68%, indicating very strong profitability. The maximum drawdown of 86.57% suggests high volatility and significant risk exposure. With a win rate of 50.0% across 6 trades, the strategy demonstrates a limited sample size.

Performance may vary depending on market conditions. During trending periods, the strategy may behave differently compared to ranging markets, impacting both returns and drawdowns.
How the Moving Average (9/21) Strategy Works
What It Is
The Moving Average (9/21) strategy is a trend-following approach that uses two Simple Moving Averages (SMAs) to generate signals. A 9-period SMA (fast line) and a 21-period SMA (slow line) are plotted on the chart. When the fast line crosses above the slow line, it signals the start of a potential uptrend, a golden cross. When the fast line crosses below the slow line, it signals a potential downtrend (a death cross) and the position exits. Moving average crossovers are among the oldest and most widely used trend-following techniques.
How Signals Are Generated
In this strategy, trading signals are generated based on predefined Moving Average crossover conditions. A buy signal occurs when the 9-period SMA crosses above the 21-period SMA, the golden cross, indicating that short-term momentum is overtaking the longer-term trend and a sustained upward move may be developing. An exit signal occurs when the 9-period SMA crosses below the 21-period SMA, the death cross, suggesting the trend has reversed or momentum has faded. On the 1 Month timeframe, each crossover represents a meaningful shift in the prevailing trend.
When It Works Best
This strategy tends to perform best in strongly trending markets with clear directional bias and sustained momentum. On the 1 Month timeframe, it excels during extended bull runs where the distance between the 9 and 21 SMAs widens steadily. Markets with clear trend cycles and minimal sideways chop produce the most favorable conditions.
When It Performs Poorly
However, the strategy may underperform during sideways or range-bound markets where crossovers generate whipsaw signals without meaningful follow-through. As a lagging indicator, moving average signals occur after the trend has already started and exit after it has reversed, meaning it can give back gains near turning points.
Strengths

Simple, clear crossover rules remove emotional decision-making and subjective interpretation
Effectively captures sustained trends that can persist across the full backtest window
Stays out of the market during trendless periods, preserving capital during sideways conditions
Limitations
As a lagging indicator, signals occur after the trend has already started, entries are never at the exact bottom
Can produce a series of false whipsaw signals during extended consolidation periods
Requires patience: trend-following strategies can experience long drawdown periods between winning trades
Why Use CoinQuant Instead of Manual Trading or Other Platforms
Choosing the right way to test and execute trading strategies is critical. Below is a comparison between CoinQuant, manual trading, and other platforms to highlight key differences in speed, accuracy, and usability.
CoinQuant is designed specifically for traders who want to validate strategies quickly and reliably without coding. Unlike manual trading or traditional platforms, it allows you to test multiple scenarios, analyze performance instantly, and iterate faster using real data.
Frequently asked questions
How does the Moving Average (9/21) strategy perform on ETH/USDT in the 2 Week timeframe?
Based on the backtest results above, the Moving Average (9/21) strategy achieved a return of 164.68% with a maximum drawdown of 86.57% on ETH/USDT over the 2 Week timeframe. Results may vary depending on volatility and overall market trends.
Is the Moving Average (9/21) strategy reliable for trading ETH/USDT?
The Moving Average (9/21) strategy can be effective in the right conditions. For ETH/USDT, it typically performs well in strongly trending markets with clear directional bias and sustained momentum. On... but may underperform during sideways or range-bound markets where crossovers generate whipsaw signals without meaningful follow-through. Backtesting helps evaluate reliability before applying it in live trading.
Why is backtesting important for trading strategies?
Backtesting allows traders to evaluate how a strategy would have performed using historical data. It helps identify strengths, weaknesses, and risk levels before applying the strategy in real markets, reducing the likelihood of unexpected losses.
How can I test the Moving Average (9/21) strategy on CoinQuant?
You can use CoinQuant to build and backtest the Moving Average (9/21) strategy without coding. Simply type the prompt shown below into the CoinQuant chat box and the platform will parse your natural language instruction, generate the strategy logic, and run the full backtest automatically.
What are the best settings for the Moving Average strategy on the 2 Week timeframe?
Traders often adjust the fast period (9 is standard, but 5 or 7 can generate earlier entries) and the slow period (21 is standard, but 50 or 200 are common for longer-term trend following). CoinQuant lets you test different MA pairings easily.