
Backtest Results
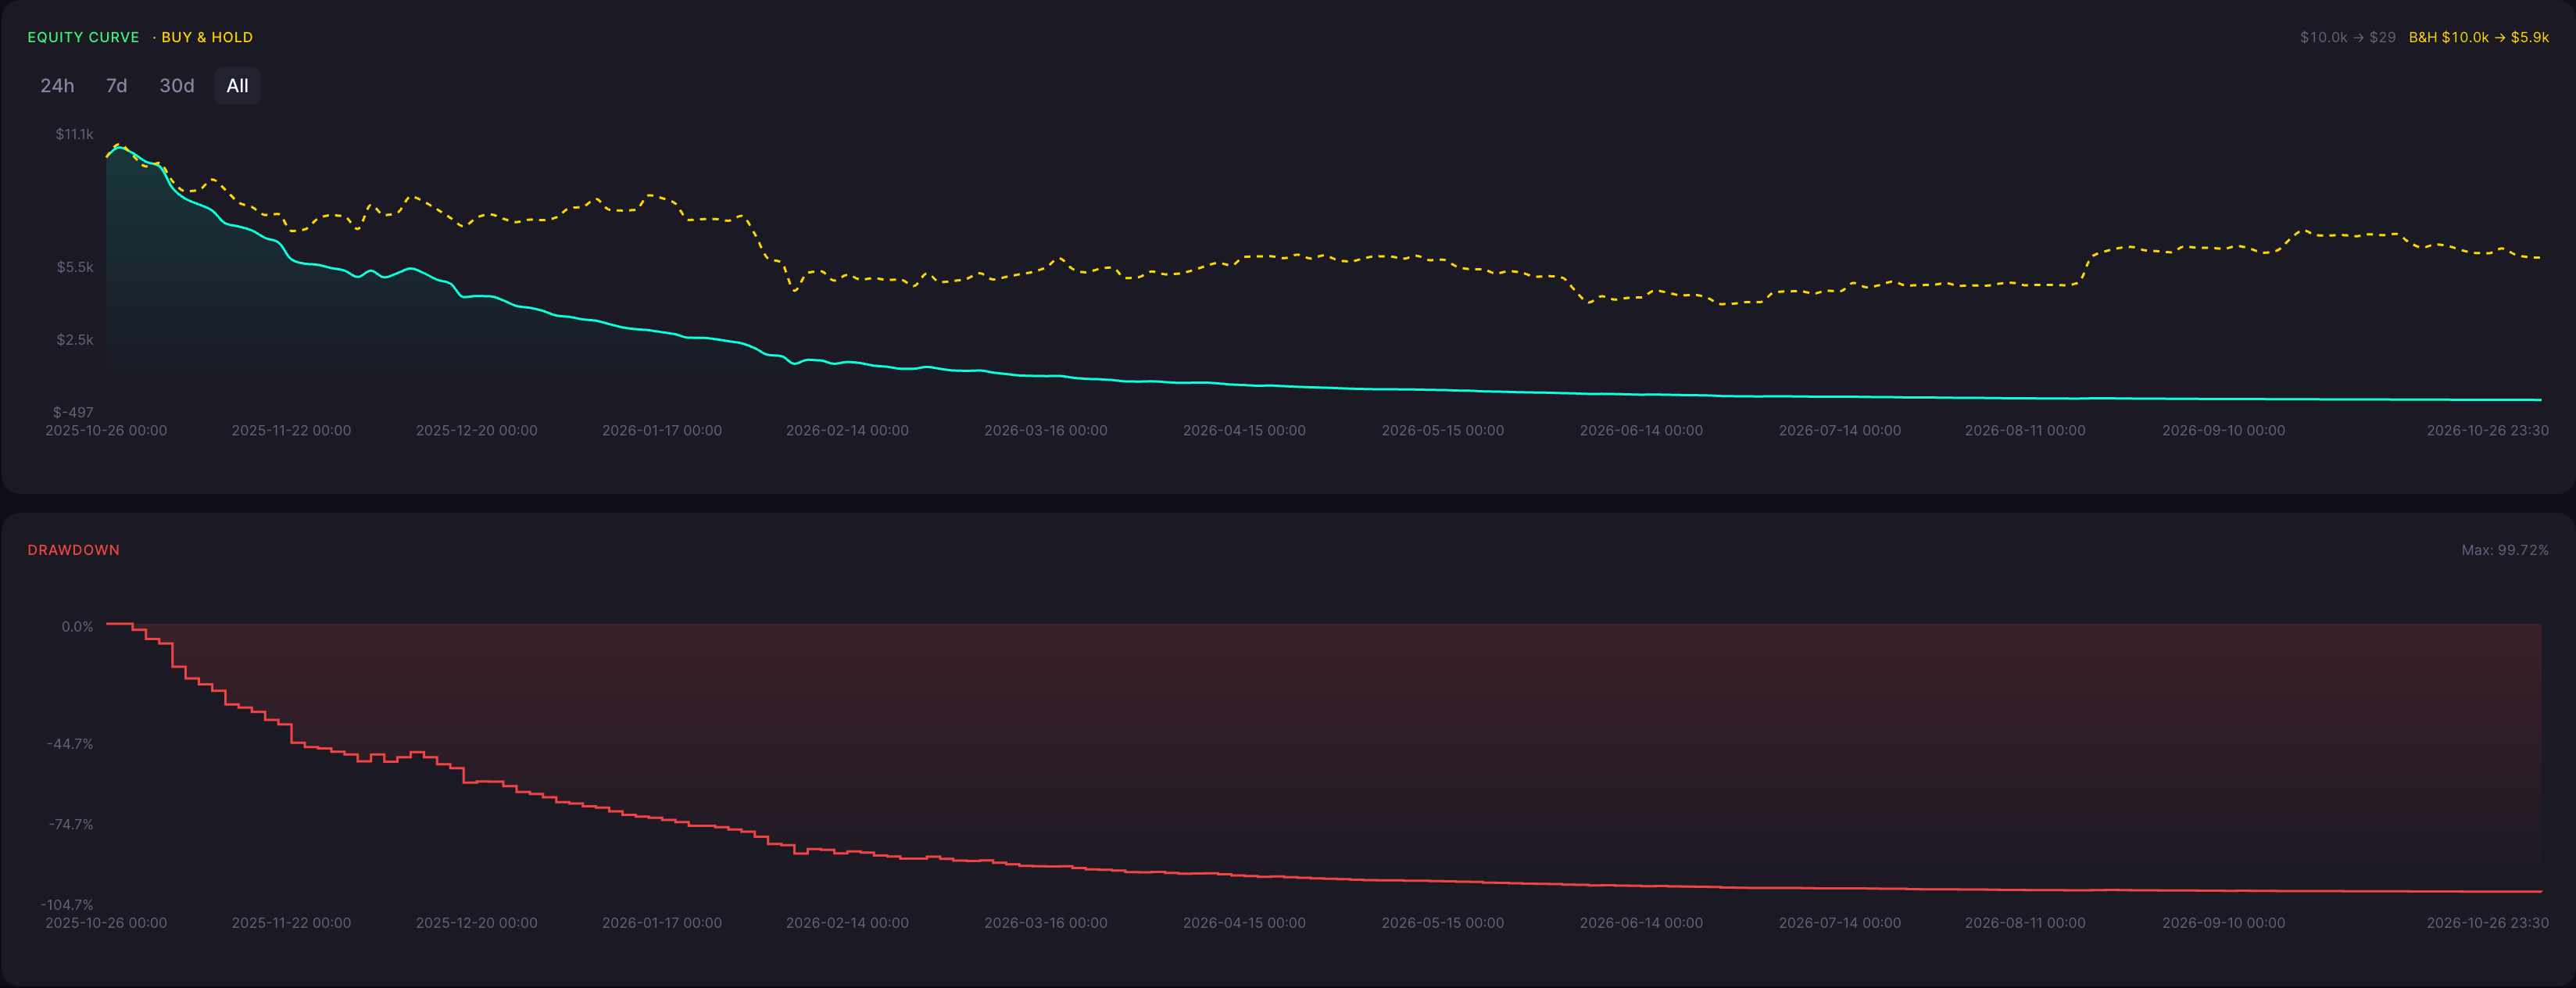
This page documents one historical CoinQuant backtest of a Hull Moving Average (HMA) crossover on ETHUSDT 30-minute candles. The strategy is long-only: it buys when Close crosses above a 10-period HMA and exits when Close crosses back below it. The run lost nearly all of its capital. The test covered 26 Oct 2025 to 26 Oct 2026. Across 2817 trades, the run finished with a total return of -99.71% and a maximum drawdown of 99.72%.
ROI
-99.71%
Win Rate
23.15%
Max DD
99.72%
Sharpe
-12.30
Profit Factor
0.51
Total Trades
2817
Backtest insights
This configuration lost money. Total return was -99.71%, and maximum drawdown was 99.72% over the test period of 26 Oct 2025 to 26 Oct 2026. Of 2,817 trades, 23.15% were winners. The profit factor of 0.51 means gross profits were about half of gross losses, and the Sharpe ratio was -12.30. For reference, the backtest reported a buy-and-hold final value of 5,877.38 for the same window. The test used 17668 price bars, and trading activity ran from 26 Oct 2025 to 26 Oct 2026. The data supplied does not isolate why the strategy failed. The high trade count and low win rate are consistent with frequent reversals after entry, but that is an interpretation, not a measured finding.

Performance may vary depending on market conditions. During trending periods, the strategy may behave differently compared to ranging markets, impacting both returns and drawdowns.
Strategy Explanation
What It Is
The Hull Moving Average is a moving average designed to follow price closely while reducing the lag of slower averages. This test uses a single 10-period HMA calculated on the Close price of each 30-minute ETHUSDT candle. Entry: go long when Close crosses above the 10-period HMA. Exit: close the long when Close crosses below the 10-period HMA. There are no extra conditions, filters, stop losses, profit targets or short trades. Configuration: spot market on Binance, price-bar data, starting capital 10,000.00 USDT, each trade uses 100.00% of current equity (capped at 100.00%), at most one open entry and one open exit, no multiple entries or exits per bar, and saved signal-handling settings for entry and exit whose effect is undocumented. Test dates: 26 Oct 2025 to 26 Oct 2026. Trading fees and some other settings were not provided. They are not a claim of zero cost.
How Signals Are Generated
Enter long when Close crosses above HMA(10); exit when Close crosses below HMA(10). The saved CoinQuant crosses-above and crosses-below rules define how an equal value at the crossover boundary is handled. There are no extra filters, shorts, discretionary entries or added stop/target conditions.
When It Works Best
Sustained directional movement can favor a moving-average crossover. This is a general strategy characteristic, not a confirmed explanation of this run's result.
When It Performs Poorly
Repeated crossings in sideways or rapidly reversing markets can create whipsaws and costs. The historical outcome must be read with that risk in mind.
Strengths

The Hull Moving Average is a moving average designed to follow price closely while reducing the lag of slower averages.
This test uses a single 10-period HMA calculated on the Close price of each 30-minute ETHUSDT candle.
Entry: go long when Close crosses above the 10-period HMA.
Limitations

Test dates: 26 Oct 2025 to 26 Oct 2026. This backtest has not been independently checked for gaps in the price data over the test dates. The dates in the performance results are not the original price candles. The 367 performance observations describe how the result was sampled, not the candle resolution of the strategy.
How the strategy's indicator starts up at the beginning of the test is not documented. Trading fees were not provided. Slippage and other trading costs were not provided. It is also unknown whether any costs are already reflected in the simulated results.
The price adjustment setting was not provided. It is a separate setting and should not be read as a slippage value. This is a single historical run on one asset, one timeframe and one parameter set. It does not show how the rules would behave on other periods, assets or settings.
Why Use CoinQuant Instead of Manual Trading or Other Platforms
Choosing the right way to test and execute trading strategies is critical. Below is a comparison between CoinQuant, manual trading, and other platforms to highlight key differences in speed, accuracy, and usability.
CoinQuant is designed specifically for traders who want to validate strategies quickly and reliably without coding. Unlike manual trading or traditional platforms, it allows you to test multiple scenarios, analyze performance instantly, and iterate faster using real data.
Frequently asked questions
Was the ETH HMA 10 crossover profitable on 30-minute candles?
No. Over the test period of 26 Oct 2025 to 26 Oct 2026, the backtest returned -99.71% with a 99.72% maximum drawdown across 2817 trades.
What are the entry and exit rules?
Long-only. Enter when Close crosses above the 10-period Hull Moving Average and exit when Close crosses below it. There are no filters, stops, targets or short trades.
Were trading fees and slippage included?
Unknown. Trading fees were not provided, which means unspecified, not zero. Slippage and other trading costs were also not provided.
How does this compare with buying and holding ETH?
The engine reported a buy-and-hold final value of 5,877.38 for the same window. The crossover strategy lost nearly all of its 10,000 USDT starting capital.
Can I reproduce this test?
Yes. Use the exact reproduction prompt on this page in CoinQuant without changes. CoinQuant also supports strategy research on other markets such as stocks, forex, gold and oil, not only crypto.