
BTC HMA Strategy 2 Week Backtest Results
See how a 10-period HMA crossover approach performs on BTC/USDT using the 2 Week timeframe. The strategy enters long when price crosses above the 10-period HMA and exits when it crosses below. All results are based on historical backtest data and do not guarantee future performance.
Live Backtest Results
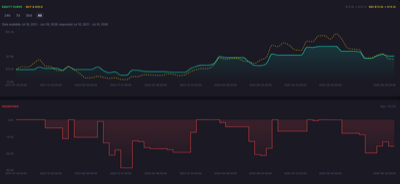
The results below show how the HMA crossover performed on BTC/USDT using the 2 Week timeframe using historical market data. The results provide insight into how the strategy would have performed under real market conditions, including profitability, risk exposure, and consistency.
ROI
80.64%
Win Rate
44.4%
Max DD
43.30%
Sharpe
0.49
Profit Factor
1.50
Total Trades
18
Backtest insights
Over the backtest period, the strategy returned 80.64%. A maximum drawdown of 43.30% indicates high risk during the testing period. The win rate of 44.4% over 18 trades suggests moderate consistency with a balanced distribution of wins and losses in how the strategy performs.

Performance may vary depending on market conditions. During trending periods, the strategy may behave differently compared to ranging markets, impacting both returns and drawdowns.
How the HMA Strategy Works
What It Is
The HMA (Hull Moving Average) crossover strategy is a trend-following approach that uses a single weighted moving average to detect momentum shifts. It calculates a moving average that assigns a formula that reduces lag significantly to older prices, then enters long when the current close crosses above that average on the 2 Week timeframe. The strategy exits when the close crosses back below, signaling that upward momentum has faded.
How Signals Are Generated
Trading signals are produced by comparing the current close to the 10-period HMA. A buy signal occurs when the close crosses above the HMA(10), indicating that recent price momentum has turned positive. A sell signal occurs when the close crosses below the HMA(10), indicating momentum has reversed. No additional filters or confirmations are applied.
When It Works Best
The strategy performs best in trending markets with clear directional momentum, where the 10-period HMA captures sustained price moves. When BTC/USDT establishes a trend, the close stays above or below the average for extended periods, allowing the strategy to ride the move.
When It Performs Poorly
The strategy may struggle in choppy or sideways markets, where frequent crossovers near the average produce false signals and whipsaw losses. In range-bound conditions, price oscillates around the HMA, generating repeated entries and exits with minimal profit per trade.
Strengths

Simple and transparent logic with no complex parameters to tune
Hull's formula significantly reduces lag compared to other moving averages
Clear entry and exit rules based on objective crossover events
Limitations

Still lags price by definition: the HMA always reacts after price has moved
Susceptible to whipsaw losses in low-momentum, range-bound markets
No built-in risk management beyond the exit signal
Why Use CoinQuant Instead of Manual Trading or Other Platforms
Choosing the right way to test and execute trading strategies is critical. Below is a comparison between CoinQuant, manual trading, and other platforms to highlight key differences in speed, accuracy, and usability.
CoinQuant is designed specifically for traders who want to validate strategies quickly and reliably without coding. Unlike manual trading or traditional platforms, it allows you to test multiple scenarios, analyze performance instantly, and iterate faster using real data.
Frequently asked questions
How does the HMA strategy perform on BTC/USDT in the 2 Week timeframe?
The performance of the HMA strategy on BTC/USDT in the 2 Week timeframe depends on market conditions. Based on the backtest results above, it achieved a return of 80.64% with a maximum drawdown of 43.30%. Results may vary depending on volatility and overall market trends.
Is the HMA strategy reliable for trading BTC/USDT?
The HMA strategy can be effective when used in the right conditions. For BTC/USDT, it typically performs well in trending markets with clear directional momentum, where the 10-period HMA captures sustained price moves with reduced lag that responds faster than SMA or WMA but may underperform during choppy or sideways markets, where frequent crossovers near the average produce false signals and whipsaw losses. Backtesting helps evaluate its reliability before applying it in live trading.
Why is backtesting important for trading strategies?
Backtesting allows traders to evaluate how a strategy would have performed using historical data. It helps identify strengths, weaknesses, and risk levels before applying the strategy in real markets, reducing the likelihood of unexpected losses.
How can I test the HMA strategy on CoinQuant?
You can use CoinQuant to build and backtest the HMA strategy without coding. Simply select your asset, define your strategy rules, and run a backtest to view detailed performance metrics instantly.
What are the best settings for the HMA strategy on 2 Week?
The best settings for the HMA strategy depend on the asset and timeframe. The configuration tested here uses a 10-period Hull Moving Average. Using a backtesting platform like CoinQuant allows you to test different configurations and identify what works best.
Explore similar strategies
