
Backtest Results
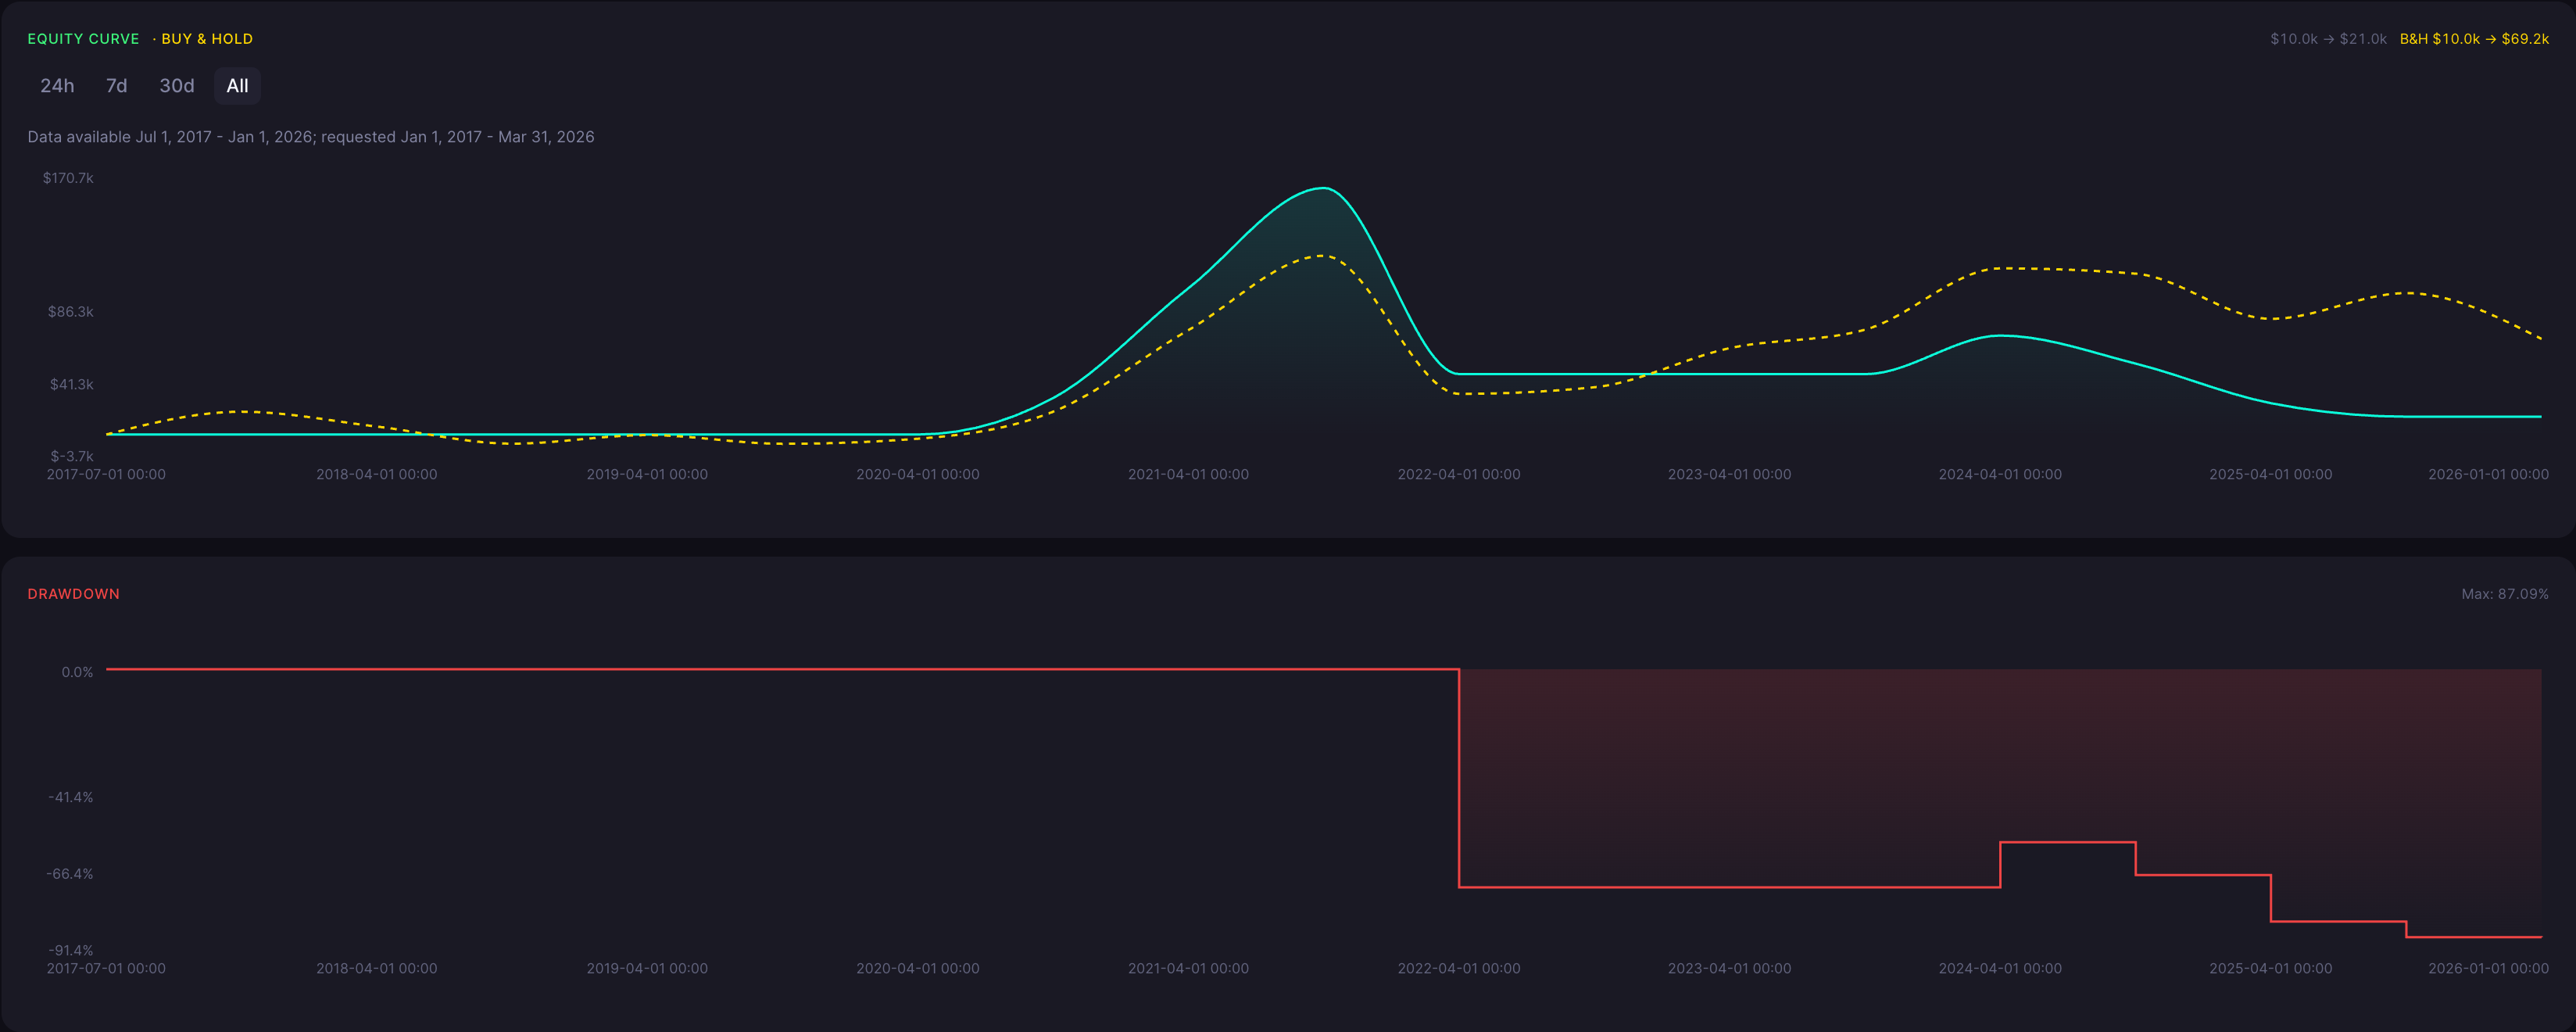
Over 1 Jul 2017 to 1 Jan 2026, the ETH/USDT test used three-month candles and a Double Exponential Moving Average to guide long positions. Starting with 10,000.00 USDT, it finished at 21,025.18 USDT and returned 110.25%. The 4 trades and maximum drawdown provide essential context for evaluating that gain.
ROI
110.25%
Win Rate
50.00%
Max DD
87.09%
Sharpe
0.41
Profit Factor
1.34
Total Trades
4
Backtest insights
A total return of 110.25% shows a positive ending outcome, but the maximum drawdown of 87.09% reveals a severe decline from a previous account peak. The 50.00% win rate across 4 trades does not establish a stable pattern. Profit factor of 1.34 indicates that trading gains outweighed trading losses in this run, without removing the risk shown by the drawdown. The small sample limits how confidently the outcome can be generalized.

Performance may vary depending on market conditions. During trending periods, the strategy may behave differently compared to ranging markets, impacting both returns and drawdowns.
How the Double Exponential Moving Average(10) Crossover Strategy Works
What It Is
The Double Exponential Moving Average combines exponential averages to reduce the delay in following prices. This test uses a 10-period line on three-month ETH/USDT candles. Despite its name, it is a price indicator, not a rule for doubling positions.
How Signals Are Generated
Close supplies the prices for the indicator. The strategy buys when Close crosses above the 10-period Double Exponential Moving Average and exits when Close crosses below it. These are long-only rules, so a downward crossing closes exposure rather than opening a short.
When It Works Best
A sustained directional trend can give the strategy room to follow rising prices. That is the intended behavior of the rules, not proof that a particular market condition caused the reported return.
When It Performs Poorly
Sideways or rapidly reversing markets can create crossings that fail to develop into lasting moves. Three-month candles also mean slow opportunities to react, and a responsive indicator cannot prevent large losses between entry and exit.
Strengths

The average is designed to reduce delay in tracking price changes.
The crossing conditions provide a clear decision process.
The long-only approach separates holding decisions from short selling.
Limitations

The historical maximum drawdown of 87.09% was severe.
Only 4 trades leave consistency uncertain.
Three-month candles can delay responses to changing prices.
Why Use CoinQuant Instead of Manual Trading or Other Platforms
Choosing the right way to test and execute trading strategies is critical. Below is a comparison between CoinQuant, manual trading, and other platforms to highlight key differences in speed, accuracy, and usability.
CoinQuant is designed specifically for traders who want to validate strategies quickly and reliably without coding. Unlike manual trading or traditional platforms, it allows you to test multiple scenarios, analyze performance instantly, and iterate faster using real data.
Frequently asked questions
How does the Double Exponential Moving Average(10) Crossover strategy perform on ETH/USDT in the 3 Month timeframe?
The performance of the Double Exponential Moving Average(10) Crossover strategy on ETH/USDT in the 3 Month timeframe depends on market conditions. Based on the backtest results above, it achieved a return of 110.25% with a maximum drawdown of 87.09%. Results may vary depending on volatility and overall market trends.
Is the Double Exponential Moving Average(10) Crossover strategy reliable for trading ETH/USDT?
The Double Exponential Moving Average(10) Crossover strategy can be effective when used in the right conditions. For ETH/USDT, it typically performs well in sustained directional trends but may underperform during sideways or rapidly reversing markets. Backtesting helps evaluate its reliability before applying it in live trading.
Why is backtesting important for trading strategies?
Backtesting allows traders to evaluate how a strategy would have performed using historical data. It helps identify strengths, weaknesses, and risk levels before applying the strategy in real markets, reducing the likelihood of unexpected losses.
How can I test the Double Exponential Moving Average(10) Crossover strategy on CoinQuant?
You can use CoinQuant to build and backtest the Double Exponential Moving Average(10) Crossover strategy without coding. Simply select your asset, define your strategy rules, and run a backtest to view detailed performance metrics instantly.
What are the best settings for the Double Exponential Moving Average(10) Crossover strategy on 3 Month?
The best settings for the Double Exponential Moving Average(10) Crossover strategy depend on the asset and timeframe. Traders often adjust parameters based on volatility and trading style. Using a backtesting platform like CoinQuant allows you to test different configurations and identify what works best.