Live Backtest Results
This backtest analyzes the performance of the Breakout strategy on BTC/USDT over the Daily timeframe using historical market data. The results provide insight into how the strategy would have performed under real market conditions, including profitability, risk exposure, and consistency.
ROI
-29.00%
Win Rate
25.0%
Max DD
37.53%
Sharpe
-1.40
Profit Factor
0.15
Total Trades
8
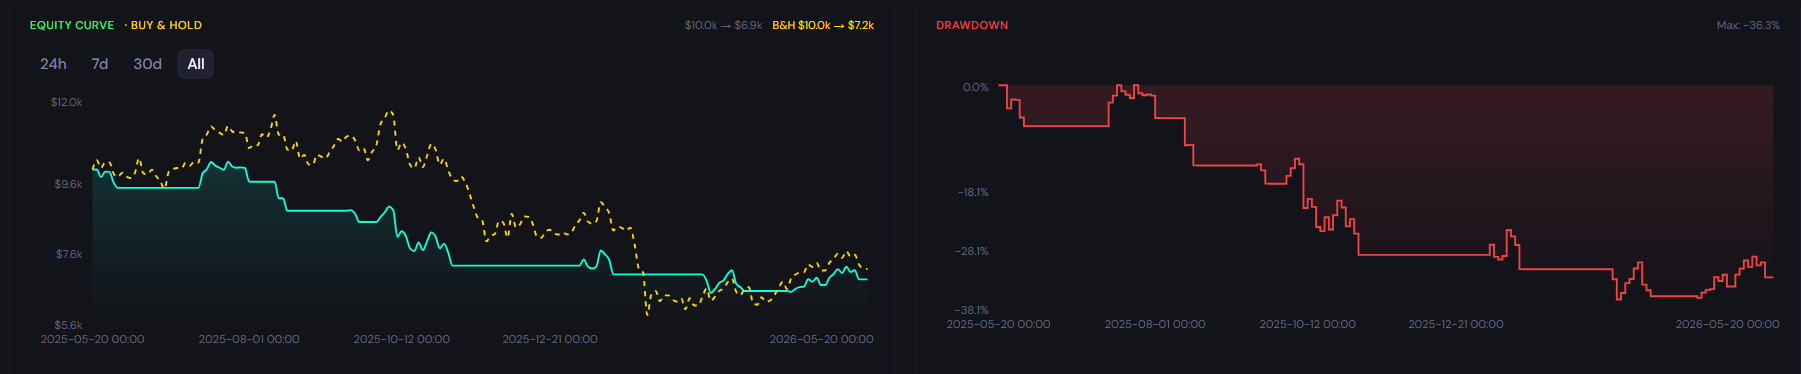
Backtest insights
The Breakout strategy generated a total return of -29.00%, indicating negative performance. The maximum drawdown of 37.53% suggests elevated risk. With a win rate of 25.0% across 8 trades, this strategy shows its performance profile clearly.

Performance may vary depending on market conditions. During trending periods, the strategy may behave differently compared to ranging markets, impacting both returns and drawdowns.
How the BTC Breakout Strategy Works
What It Is
The BTC Breakout strategy is a momentum-based approach that identifies key support and resistance levels on the 2 Week timeframe. When price breaks above a defined resistance level with conviction, the strategy enters a long position, aiming to capture the continuation of the directional move.
How Signals Are Generated
Trading signals are generated when BTC/USDT price breaks through established support or resistance levels on the 2 Week timeframe. A buy signal occurs when price breaks above the 20-period high, indicating bullish momentum. An exit signal occurs when price breaks below the 10-period low, suggesting trend exhaustion.
When It Works Best
This strategy performs best in trending markets with clear directional momentum following consolidation periods. Strong volume-backed breakouts from well-defined ranges produce the highest-quality signals.
When It Performs Poorly
The strategy may underperform during highly volatile conditions, ranging markets without clear direction, or low-volume periods where false breakouts are common. Whipsaws can occur when price briefly breaks a level only to reverse immediately.
Strengths

Captures large directional moves early, maximizing trend participation
Clear, rule-based entry and exit signals reduce emotional trading
Works across multiple timeframes with appropriate parameter adjustments
Limitations
False breakouts in low-volume periods can generate losing trades
Whipsaws in ranging markets degrade performance
Requires patience during consolidation phases
Why Use CoinQuant Instead of Manual Trading or Other Platforms
Choosing the right way to test and execute trading strategies is critical. Below is a comparison between CoinQuant, manual trading, and other platforms to highlight key differences in speed, accuracy, and usability.
CoinQuant is designed specifically for traders who want to validate strategies quickly and reliably without coding. Unlike manual trading or traditional platforms, it allows you to test multiple scenarios, analyze performance instantly, and iterate faster using real data.
Frequently asked questions
How does the Breakout strategy perform on BTC/USDT in the Daily timeframe?
The Breakout strategy on the Daily timeframe generated a return of -29.00% with a maximum drawdown of 37.53% and a win rate of 25.0% across 8 trades, based on historical backtest data.
Is the Breakout strategy reliable for trading BTC/USDT?
The Breakout strategy has shown its performance in backtesting on the Daily timeframe. However, all trading strategies carry risk. Past performance does not guarantee future results.
Why is backtesting important for trading strategies?
Backtesting allows traders to evaluate how a strategy would have performed using historical market data before risking real capital. It reveals key metrics like ROI, drawdown, and win rate that help assess whether a strategy has a genuine edge.
How can I test the Breakout strategy on CoinQuant?
You can use CoinQuant to build and backtest the Breakout strategy in minutes. Simply describe your strategy in natural language, select BTC/USDT and the Daily timeframe, and CoinQuant generates a full backtest. No coding required.
What are the best settings for the Breakout strategy on the Daily timeframe?
The optimal settings depend on the specific parameters used. CoinQuant allows you to test multiple parameter combinations to find the configuration that performs best on the Daily timeframe.