Live Backtest Results
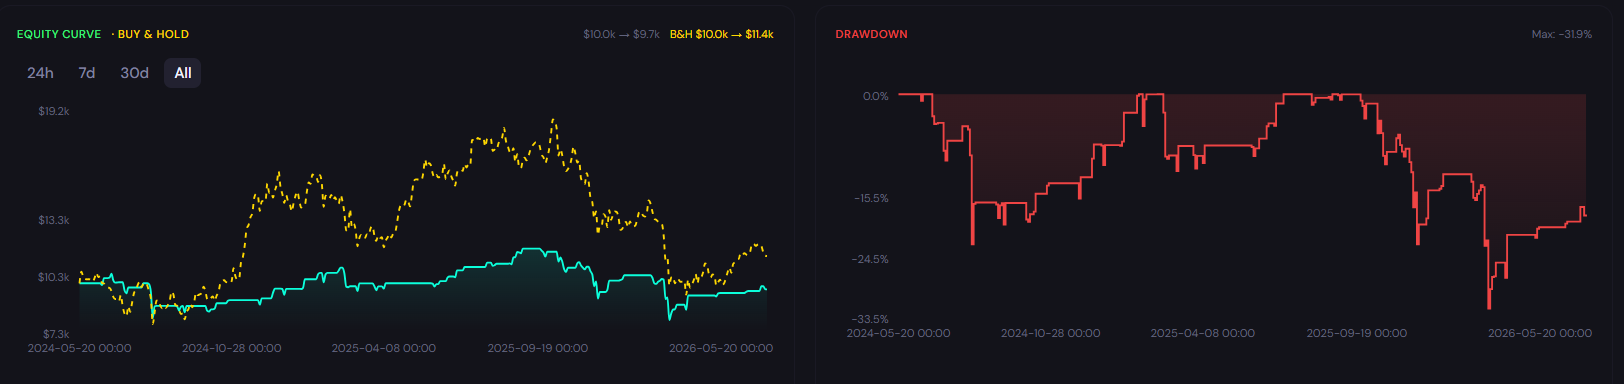
This backtest analyzes the performance of the Bollinger Bands strategy on BTC/USDT over the 6 Hour timeframe using historical market data. The results provide insight into how the strategy would have performed under real market conditions, including profitability, risk exposure, and consistency.
ROI
-1.54%
Win Rate
64.6%
Max DD
31.87%
Sharpe
0.11
Profit Factor
0.98
Total Trades
48
Backtest insights
The Bollinger Bands strategy generated a total return of -1.54%, indicating slightly negative performance. The maximum drawdown of 31.87% suggests elevated risk. With a win rate of 64.6% across 48 trades, the strategy demonstrates a limited but useful sample size.

Performance may vary depending on market conditions. During trending periods, the strategy may behave differently compared to ranging markets, impacting both returns and drawdowns.
How the Bollinger Bands Strategy Works
What It Is
Developed by John Bollinger, Bollinger Bands measure price volatility by wrapping 2-standard-deviation channels around a 20-period simple moving average. The outer bands act as dynamic support and resistance that widen during volatile periods and narrow during calm ones. The strategy tested on this page enters when BTC/USDT closes below the lower band and exits when it returns to the middle band.
How Signals Are Generated
In this strategy, trading signals are generated when BTC/USDT closes below the lower Bollinger Band (20,2), suggesting the price has moved meaningfully below its recent average range. The exit occurs when price reclaims the 20-period middle band. On the 6 Hour timeframe, this generates a steady flow of signals — producing 48 trades during the backtest window — while still filtering out the noise of shorter timeframes.
When It Works Best
This strategy tends to perform best during moderate trending environments with periodic pullbacks. On 6 Hour candles, the Bollinger Bands capture the rhythm of price swings, allowing entries near local lows and exits as the reversion plays out. Range-bound conditions with well-defined extremes produce the most favorable outcomes.
When It Performs Poorly
However, the strategy may underperform during high-volatility regime changes where the assumption that price will revert to the mean breaks down. The 6 Hour timeframe can generate signals that look valid but occur during a larger structural shift. Breakout-driven markets are particularly challenging for mean-reversion approaches.
Strengths

Straightforward rules require no interpretation of complex indicators or patterns
Adapts to volatility conditions automatically as bands expand and contract
The mid-range timeframe offers a practical trade-off between signal quality and frequency
Limitations
During strong trending phases, the strategy can produce premature entries against the dominant direction
As a lagging indicator, signals confirm conditions that have already developed rather than predicting new ones
Sudden volatility expansions may generate band touches during structural shifts rather than temporary extremes
Why Use CoinQuant Instead of Manual Trading or Other Platforms
Choosing the right way to test and execute trading strategies is critical. Below is a comparison between CoinQuant, manual trading, and other platforms to highlight key differences in speed, accuracy, and usability.
CoinQuant is designed specifically for traders who want to validate strategies quickly and reliably without coding. Unlike manual trading or traditional platforms, it allows you to test multiple scenarios, analyze performance instantly, and iterate faster using real data.
Frequently asked questions
How does the Bollinger Bands strategy perform on BTC/USDT in the 6 Hour timeframe?
The performance of the Bollinger Bands strategy on BTC/USDT in the 6 Hour timeframe depends on market conditions. Based on the backtest results above, it achieved a return of -1.54% with a maximum drawdown of 31.87%. Results may vary depending on volatility and overall market trends.
Is the Bollinger Bands strategy reliable for trading BTC/USDT?
The Bollinger Bands strategy can be effective when used in the right conditions. For BTC/USDT, it typically performs well in range-bound markets with well-defined support and resistance levels but may underperform during sharp trend breakouts with sustained directional momentum, as well as high-volatility regime changes. Backtesting helps evaluate its reliability before applying it in live trading.
Why is backtesting important for trading strategies?
Backtesting allows traders to evaluate how a strategy would have performed using historical data. It helps identify strengths, weaknesses, and risk levels before applying the strategy in real markets, reducing the likelihood of unexpected losses.
How can I test the Bollinger Bands strategy on CoinQuant?
You can use CoinQuant to build and backtest the Bollinger Bands strategy without coding. Simply type the prompt shown below into the CoinQuant chat box and the platform will parse your natural language instruction, generate the strategy logic, and run the full backtest automatically.
What are the best settings for the Bollinger Bands strategy on the 6 Hour timeframe?
The best settings for the Bollinger Bands strategy depend on the asset and timeframe. Traders often adjust the period (20 is standard, but 10 or 14 can generate more signals with more noise on the 6 Hour chart) and the standard deviation multiplier (2 is standard, but some use 1.5 for tighter entries or 2.5 for wider, higher-confidence signals). Using a backtesting platform like CoinQuant allows you to test different configurations and identify what works best.