Live Backtest Results
This backtest analyzes the performance of the Bollinger Bands strategy on BTC/USDT over the 1 Minute timeframe using historical market data. The results provide insight into how the strategy would have performed under real market conditions, including profitability, risk exposure, and consistency.
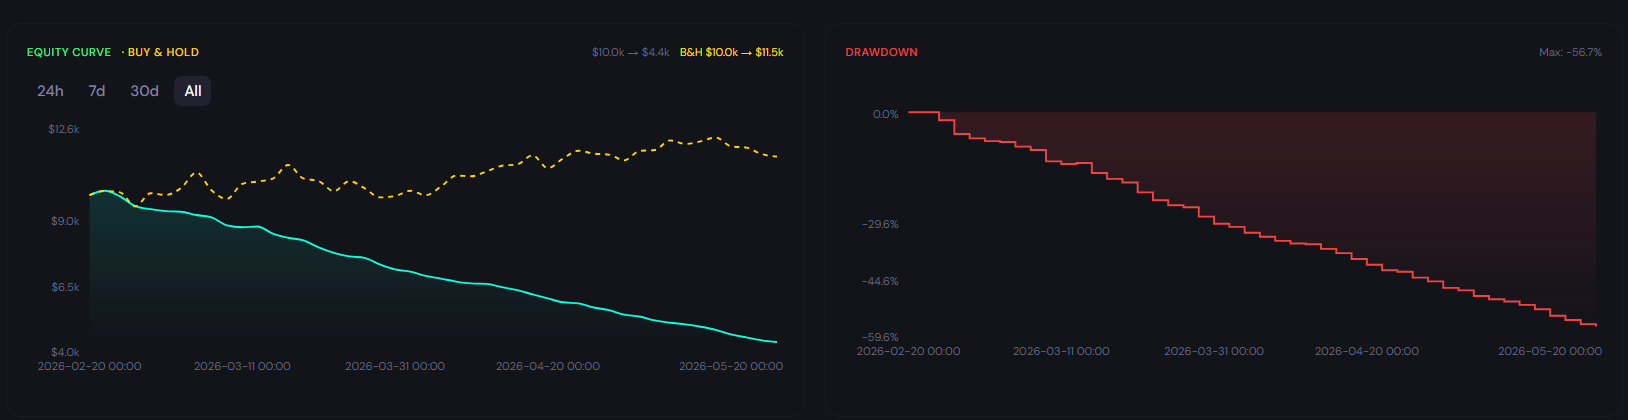
ROI
-55.30%
Win Rate
54.0%
Max DD
55.30%
Sharpe
-18.83
Profit Factor
0.63
Total Trades
2412
Backtest insights
The Bollinger Bands strategy generated a total return of -55.30%, indicating negative performance. The maximum drawdown of 55.30% suggests high volatility and significant risk exposure. With a win rate of 54.0% across 2412 trades, the strategy demonstrates high consistency.

Performance may vary depending on market conditions. During trending periods, the strategy may behave differently compared to ranging markets, impacting both returns and drawdowns.
How the Bollinger Bands Strategy Works
What It Is
Developed by John Bollinger, Bollinger Bands measure price volatility by wrapping 2-standard-deviation channels around a 20-period simple moving average. The outer bands act as dynamic support and resistance that widen during volatile periods and narrow during calm ones. The strategy tested on this page enters when BTC/USDT closes below the lower band and exits when it returns to the middle band.
How Signals Are Generated
In this strategy, a buy signal fires when BTC/USDT closes beneath the lower Bollinger Band (20,2), indicating a short-term oversold condition. The position exits when price crosses back above the 20-period simple moving average. With 1 Minute candles, signals appear frequently: the backtest recorded 2412 individual trades. This pace makes the strategy responsive but also sensitive to transaction costs and slippage.
When It Works Best
This strategy tends to perform best during intraday sessions where BTC/USDT oscillates predictably between short-term extremes. On the 1 Minute timeframe, it excels in quiet, low-volatility hours where quick reversions at the bands allow the strategy to compound small gains over many trades.
When It Performs Poorly
However, the strategy may underperform during news-driven volatility events where BTC/USDT moves rapidly in one direction. On the 1 Minute timeframe, false band touches become more common, and transaction costs from frequent trading can erode net returns significantly. Fast-moving markets where spreads widen amplify these effects.
Strengths

Fast signal generation means the strategy adapts quickly to changing intraday conditions
Systematic rules remove hesitation and emotion from high-speed decision-making
Small, repeated gains compound effectively when the win rate is favorable
Limitations
Execution quality matters significantly: slippage during volatile periods can erode returns quickly
High-frequency false positives mean the strategy needs a consistently strong win rate to overcome friction costs
On very short timeframes, price can move through bands and back before a trade can be executed
Why Use CoinQuant Instead of Manual Trading or Other Platforms
Choosing the right way to test and execute trading strategies is critical. Below is a comparison between CoinQuant, manual trading, and other platforms to highlight key differences in speed, accuracy, and usability.
CoinQuant is designed specifically for traders who want to validate strategies quickly and reliably without coding. Unlike manual trading or traditional platforms, it allows you to test multiple scenarios, analyze performance instantly, and iterate faster using real data.
Frequently asked questions
How does the Bollinger Bands strategy perform on BTC/USDT in the 1 Minute timeframe?
The performance of the Bollinger Bands strategy on BTC/USDT in the 1 Minute timeframe depends on market conditions. Based on the backtest results above, it achieved a return of -55.30% with a maximum drawdown of 55.30%. Results may vary depending on volatility and overall market trends
Is the Bollinger Bands strategy reliable for trading BTC/USDT?
The Bollinger Bands strategy can be effective when used in the right conditions. For BTC/USDT, it typically performs well in range-bound intraday conditions with regular price oscillations between well-defined short-term extremes but may underperform during fast-moving news-driven markets, extreme volatility events, and conditions where spreads widen significantly. Backtesting helps evaluate its reliability before applying it in live trading.
Why is backtesting important for trading strategies?
Backtesting allows traders to evaluate how a strategy would have performed using historical data. It helps identify strengths, weaknesses, and risk levels before applying the strategy in real markets, reducing the likelihood of unexpected losses.
How can I test the Bollinger Bands strategy on CoinQuant?
You can use CoinQuant to build and backtest the Bollinger Bands strategy without coding. Simply type the prompt shown below into the CoinQuant chat box and the platform will parse your natural language instruction, generate the strategy logic, and run the full backtest automatically.
What are the best settings for the Bollinger Bands strategy on the 1 Minute timeframe?
The best settings for the Bollinger Bands strategy depend on the asset and timeframe. On shorter timeframes, traders sometimes widen to 2.5 standard deviations to reduce noise or tighten to 1.5 for faster signals. The period can also be shortened (from 20 to 10 or 14) to generate more frequent entries, though this increases sensitivity to false signals. Using a backtesting platform like CoinQuant allows you to test different configurations and identify what works best.