
Does a Stop Loss Help a Trend Strategy? Solana Linear Regression Cross With and Without a 5% Stop
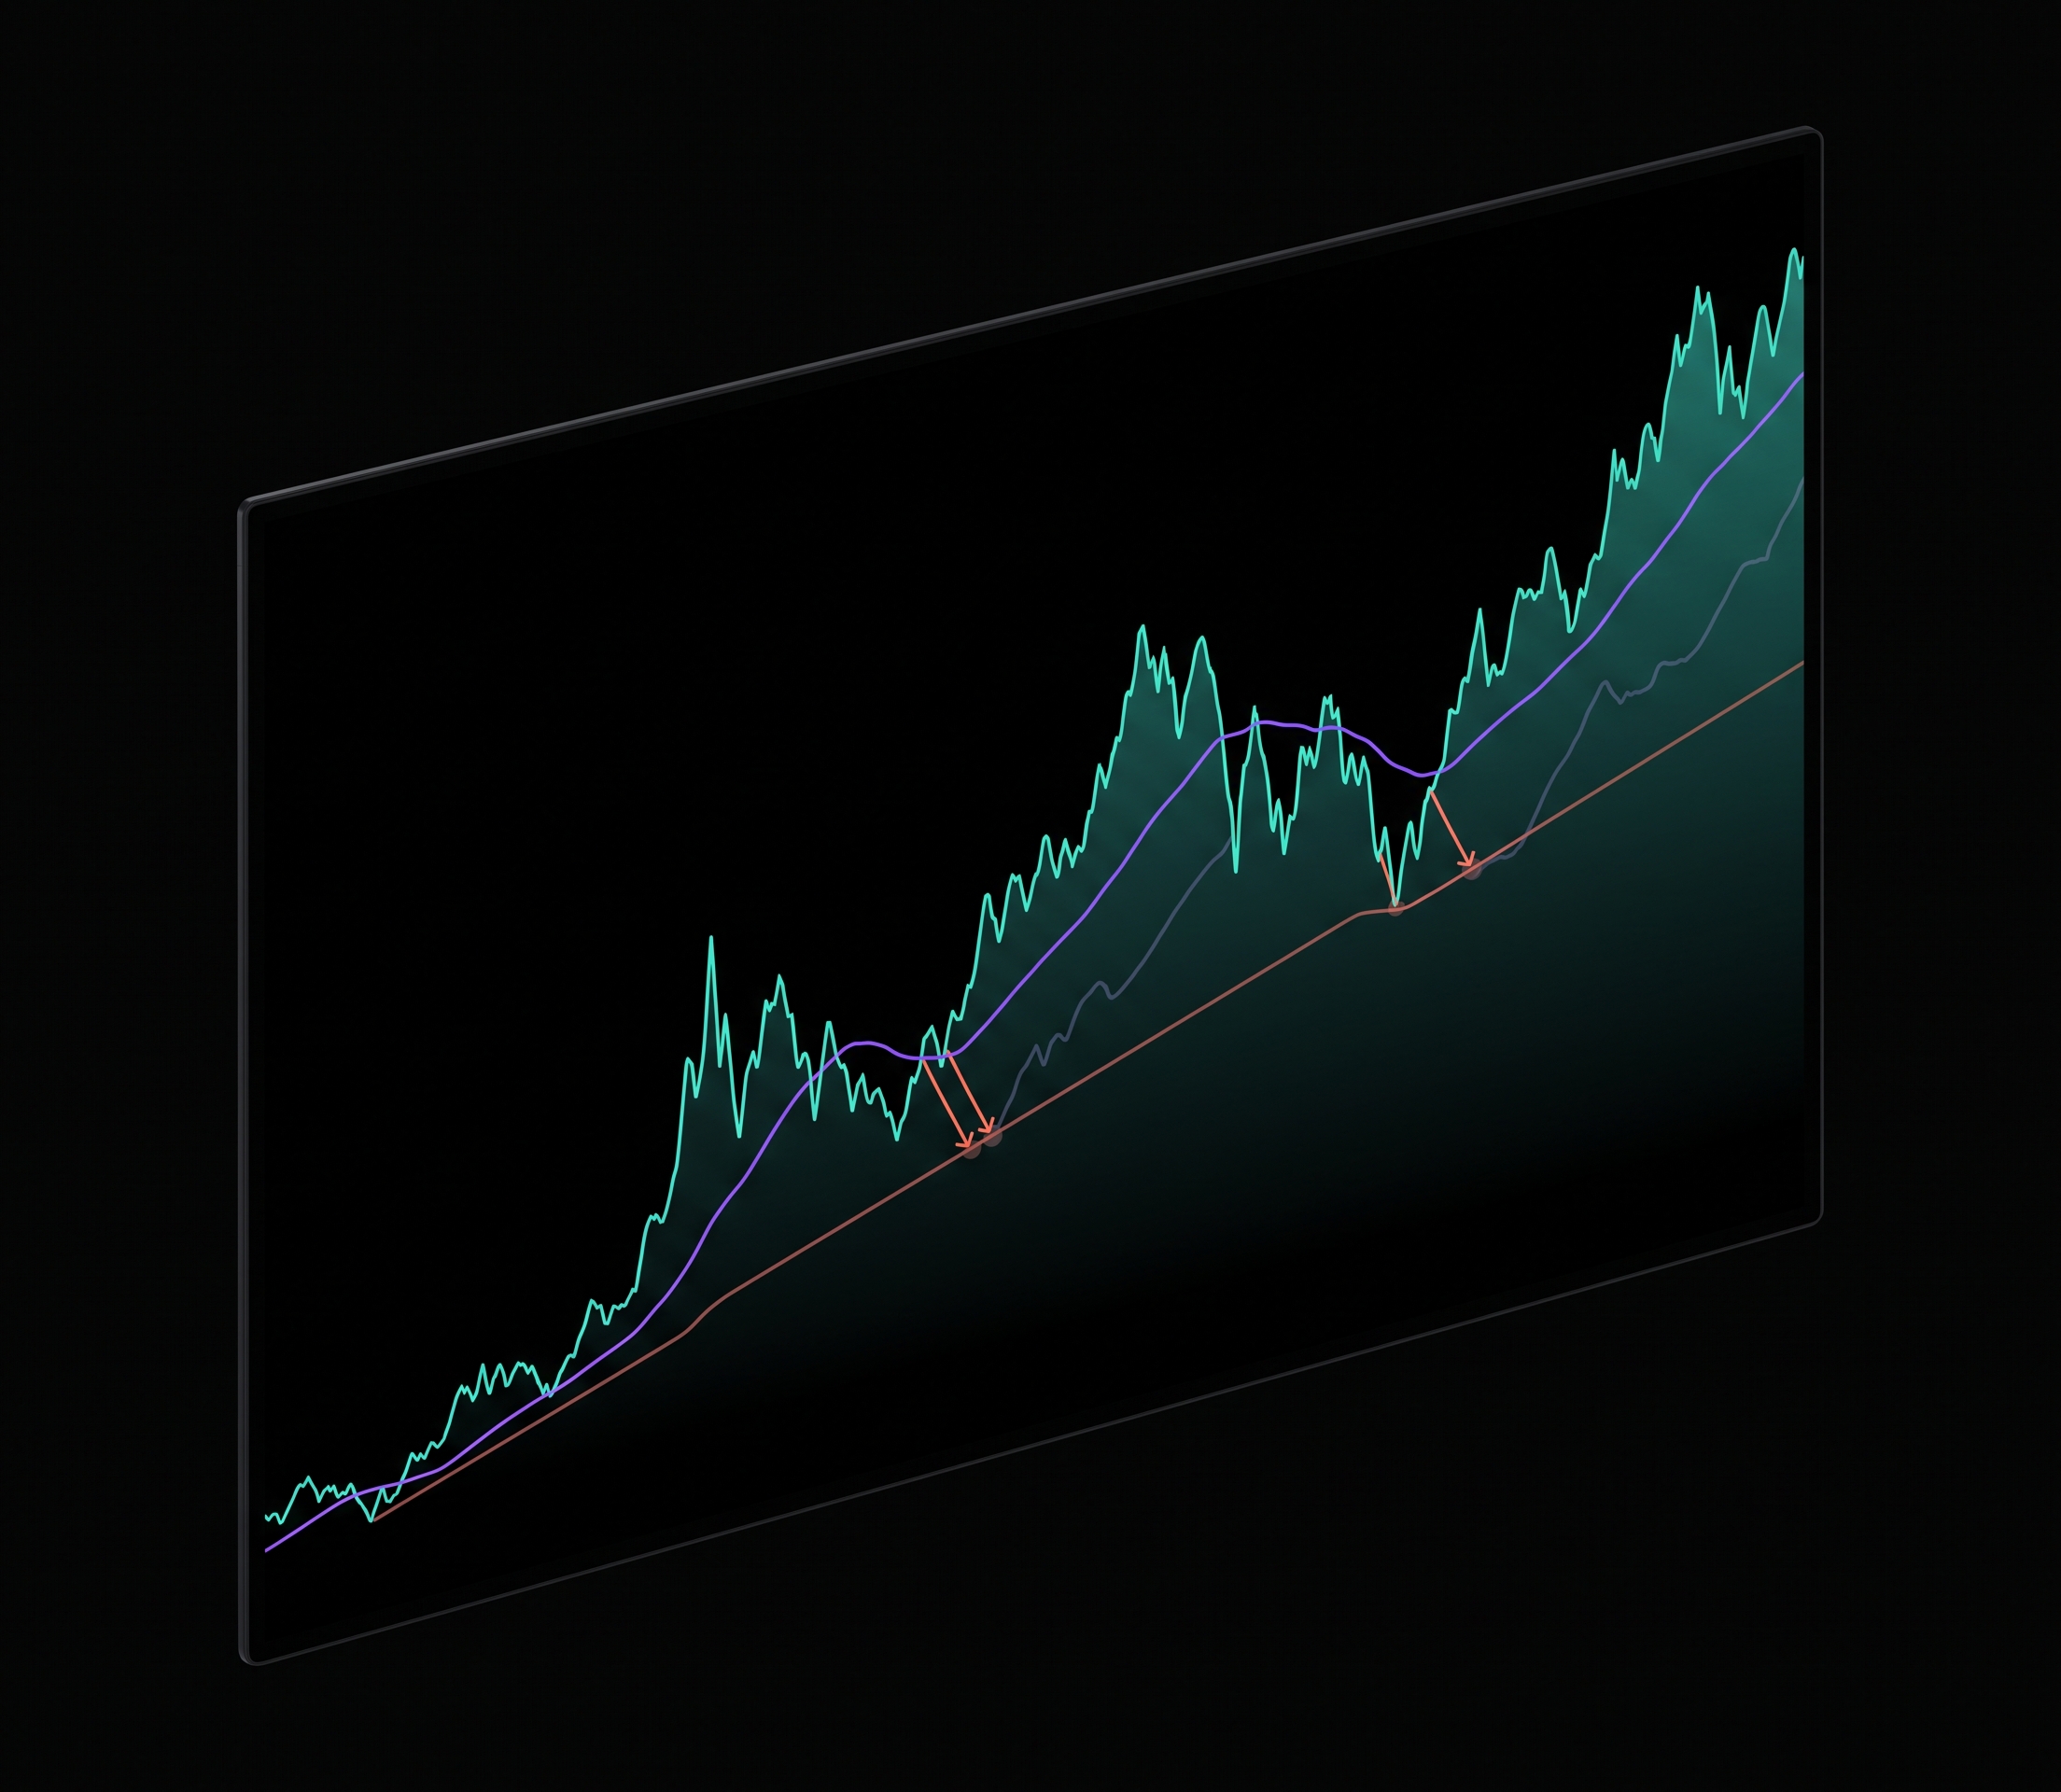
A stop loss trend following strategy sounds like the safe version of trend following: the same entries plus free insurance. In this test it was the opposite. The same Solana trend rule returned +138.64% without a stop and -5.15% with a fixed 5% stop, on identical entries, window and fees.
The stop did what stops are supposed to do on the downside: the worst single loss in the backtest shrank from -$6,561.74 to -$849.67. But it also stopped out seven of the strategy's 17 winning trades before they could run, and the maximum drawdown only improved from 69.12% to 60.71%.
This article reports what one 5% stop changed for one stop loss trend following strategy on daily SOL from August 2021 to August 2026. It does not claim a general rule about stops.
Stop Loss Trend Following Strategy: Why Traders Disagree
Trend followers win by holding a few large moves and losing small on many false starts. The argument over stops is about which side of that trade-off a stop helps.
| The case for a stop | The case against a stop |
|---|---|
| Caps the damage of any single failed trend | A trend often dips before it runs, and a tight stop exits on the dip |
| Limits the loss when the exit signal lags a fast drop | The trend exit already acts as a stop, so a second exit can duplicate it |
| Makes position risk easy to state in advance | Stopped-out trades need a fresh entry signal to get back in, which may come much later |
Both arguments are plausible, which is why this is a question for a backtest. The only way to know which effect dominates is to run the same strategy both ways.
Test Setup
The base strategy is a linear regression trend cross: buy when the daily close crosses above its 100-period linear regression line, sell when it crosses back below. The stop version adds one exit and changes nothing else.
| Parameter | Without stop | With 5% stop |
|---|---|---|
| Strategy | SOL Linear Regression Cross 1D 2021-2026 | SOL Linear Regression Cross + SL5 1D 2021-2026 |
| Entry | Close crosses above Linear Regression (period 100) | Close crosses above Linear Regression (period 100) |
| Exit | Close crosses below Linear Regression (period 100) | Close crosses below Linear Regression (period 100), or a stop loss 5% below the entry price, whichever comes first |
| Instrument and data | SOLUSDT (spot, Binance), Kaiko via CoinQuant | SOLUSDT (spot, Binance), Kaiko via CoinQuant |
| Timeframe and window | Daily (1D), 2021-08-01 to 2026-08-01 | Daily (1D), 2021-08-01 to 2026-08-01 |
| Capital and sizing | $10,000, 100% of equity per entry | $10,000, 100% of equity per entry |
| Fees | 0.1% taker, modelled (no slippage set) | 0.1% taker, modelled (no slippage set) |
| Direction | Long only, no leverage | Long only, no leverage |
Both versions took the same 61 entries on the same dates. After a stop-out, the stop version waits for the next fresh cross above the line, exactly like the base version after a signal exit.
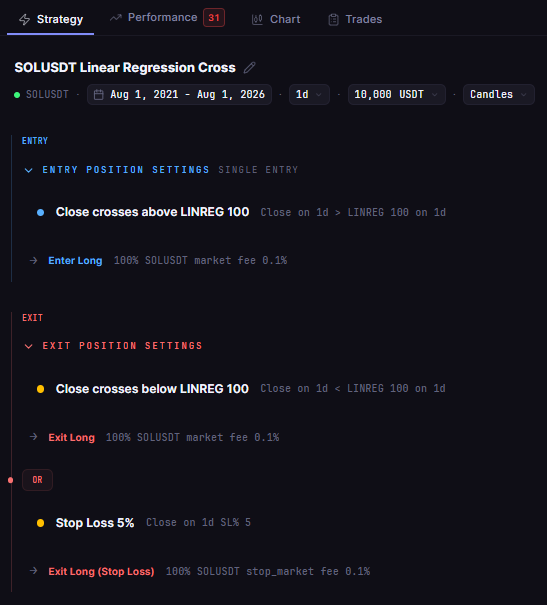
SOL Linear Regression Cross + SL5 1D 2021-2026 in the CoinQuant strategy builder: the only change from the base strategy is a 5% stop loss exit next to the original linear regression exit.
Screenshot from the author's CoinQuant account. Backtest results are hypothetical, based on historical data with modelled fees, and do not guarantee future performance. Not financial advice.
Results: With Stop, Without Stop, Buy and Hold
The stop turned a +138.64% strategy into a -5.15% one. Holding Solana returned +110.02% over the same window, and holding Bitcoin +57.33%.
| Metric | Without stop | With 5% stop | SOL buy and hold | BTC Spot Comparison |
|---|---|---|---|---|
| Strategy | SOL Linear Regression Cross 1D 2021-2026 | SOL Linear Regression Cross + SL5 1D 2021-2026 | SOL Buy and Hold 1D 2021-2026 | BTC Buy and Hold 1D 2021-2026 |
| Total Return | +138.64% | -5.15% | +110.02% | +57.33% |
| Final Balance | $23,864.27 | $9,485.28 | $21,002.12 | $15,733.43 |
| Total Trades | 61 | 61 | 1 | 1 |
| Win Rate | 27.87% (17W / 44L) | 16.39% (10W / 51L) | n/a (single hold) | n/a (single hold) |
| Profit Factor | 1.25 | 0.98 | n/a | n/a |
| Sharpe Ratio | 0.58 | 0.18 | 0.64 | 0.44 |
| Max Drawdown | 69.12% | 60.71% | 96.27% | 76.63% |
| Average Win / Average Loss | $4,142.41 / $1,285.38 | $2,140.96 / $429.89 | n/a | n/a |
| Best Trade / Worst Trade | +$17,327.89 / -$6,561.74 | +$9,748.79 / -$849.67 | n/a | n/a |
| Time in Market | 46.41% | 24.03% | 100% | 100% |
| Total Fees | $2,717.37 | $1,265.61 | $31.01 | $25.74 |
In the stop version, 33 of the 61 trades ended at the stop and 28 at the regular signal exit. On those 28 trades, the resting stop order was cancelled when the signal exit fired first.
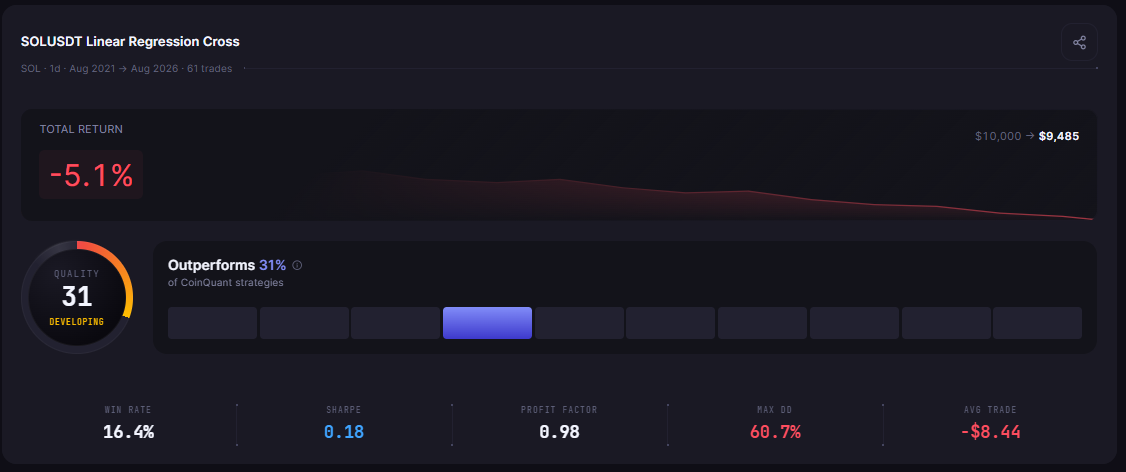
SOL Linear Regression Cross + SL5 1D 2021-2026 finished at -5.15% after 61 trades.
Screenshot from the author's CoinQuant account. Backtest results are hypothetical, based on historical data with modelled fees, and do not guarantee future performance. Not financial advice.
What the Stop Changed (and What One Test Cannot Show)
It shrank the large losses
The stop worked as designed on the losing side. All 20 trades that lost more than $1,000 without a stop lost less with it. The average loss fell from $1,285.38 to $429.89, and the worst trade entered at $132.24 on 2025-12-07: without a stop it lost $6,561.74 by the signal exit on 2026-01-31, with the stop it lost $609.09 on 2025-12-15.
It also cut seven winners short
Many Solana trends in this window did not start in a straight line. Seven of the 17 trades that won without a stop dipped 5% first, hit the stop and closed at a loss. The costliest example entered at $119.03 on 2024-02-28: without a stop it made +$12,367.45, with the stop it lost $779.24 within a week.
The winners that survived were smaller too, because the account was smaller by then. The same September to December 2023 trade that made +$17,327.89 in the base version made +$9,748.79 in the stop version.
The drawdown barely improved
Capping each loss did not cap a losing streak. The stop version lost 18 trades in a row between November 2021 and June 2023, and those small losses compounded into a 60.71% maximum drawdown, against 69.12% without the stop.
Fees fell from $2,717.37 to $1,265.61 and time in market from 46.41% to 24.03%, but that was a side effect of smaller balances and shorter holds, not a benefit on its own. Lower fees did not make up for the winners the stop cut short.
What one test cannot show
One stop level. A wider stop, such as 10% or 15%, might keep more winners; this test only measured 5%
One strategy and one asset. A slower trend rule or a less volatile asset could react differently to the same stop
One window. August 2021 to August 2026 includes the 2022 bear market and strong SOL rallies in late 2023 and 2024; other periods could favour the stop
Idealised stop fills. All 33 stops filled exactly at the stop price with zero slippage in the trade log, which is kinder to the stop version than a fast real market may be
The Practical Lesson
On daily SOL from August 2021 to August 2026, a fixed 5% stop turned a +138.64% linear regression trend strategy into a -5.15% one on the same 61 entries
The stop cut the worst loss from -$6,561.74 to -$849.67, but seven of the 17 winners were stopped out before they ran
The maximum drawdown only improved from 69.12% to 60.71%, because an 18-trade losing streak compounded small losses
Neither result proves that stops are good or bad in general; it shows that a tight stop and a slow trend exit can work against each other
If you want a stop on a trend strategy, test the stop distance the same way: one change at a time, on the same entries and window. For how fixed, trailing and volatility-based stops compare, see Stop Loss Strategies Compared: Fixed vs Trailing vs Volatility-Based, and for a stop on a mean-reversion strategy, see Stop Loss vs Take Profit on XRP.
CoinQuant, an AI trading platform, lets you add a Stop Loss (Percentage) exit to a strategy and re-run it on identical settings. Build trading strategies on real data. No coding required.
Add one stop and see what it changes. Run this stop loss backtest free on CoinQuant
Disclaimer:
Key Takeaway
