
ETH Volume Surge Breakout: Does Volume Spike Predict Ethereum Breakouts?
Ethereum has been the stronger of the two largest crypto assets through mid-2026, with record ETF inflows and five straight days of outperformance against Bitcoin. That strength puts a specific question in front of traders: does a volume breakout strategy actually predict the next move when volume spikes?
This article tests that volume breakout strategy with two backtests of the same mechanical rules on CoinQuant, on the four-hour and daily timeframes, over a 12-month window ending August 2026. Fees and slippage are included in every result. The answer is not what the hype suggests.
What the Volume Surge Breakout Strategy Does
The strategy is deliberately simple, built around one signal: traded volume versus its own average.
Entry: long when Ethereum's volume crosses above the 20-period simple moving average of volume
Exit: long when price closes back below the 20-period simple moving average of price
The logic is the classic breakout assumption: a volume spike means institutional participation, and participation means the move will continue. No price filter, no trend filter, no second indicator. The strategy enters on volume alone and exits on price structure. Long only, no leverage.
Test Setup
| Parameter | Setting |
|---|---|
| Instrument | ETHUSDT (Binance spot) |
| Timeframes | 4H and 1D |
| Period | Aug 12 2025 to Aug 12 2026 |
| Entry | Volume crosses above SMA(20) of volume |
| Exit | Close crosses below SMA(20) of close |
| Fees | 0.1% taker (Binance standard) |
| Initial capital | $10,000 |
| Position size | 100% of equity per entry |
| Data Source | Kaiko via CoinQuant |
The Backtest Results
Four-Hour Timeframe: 97 Trades, -54.25%
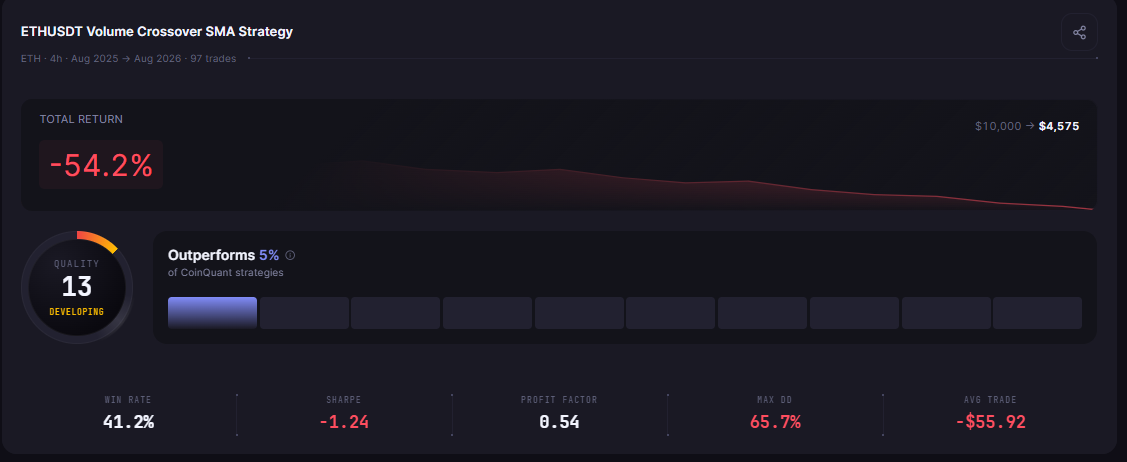
On the 4H timeframe the strategy traded constantly: 97 trades in 12 months, in the market 78.8% of the time. The result was a total return of -54.25%: $10,000 became $4,575.
| Metric | Result |
|---|---|
| Total Return | -54.25% ($10,000 to $4,575) |
| Total Trades | 97 |
| Win Rate | 41.2% |
| Profit Factor | 0.54 |
| Sharpe Ratio | -1.24 |
| Max Drawdown | 65.7% |
| Average Win | $162.00 |
| Average Loss | $208.86 |
| Best Trade | +$627.56 |
| Worst Trade | -$2,210.82 |
| Time in Market | 78.8% |
| Total Fees | $265.30 |
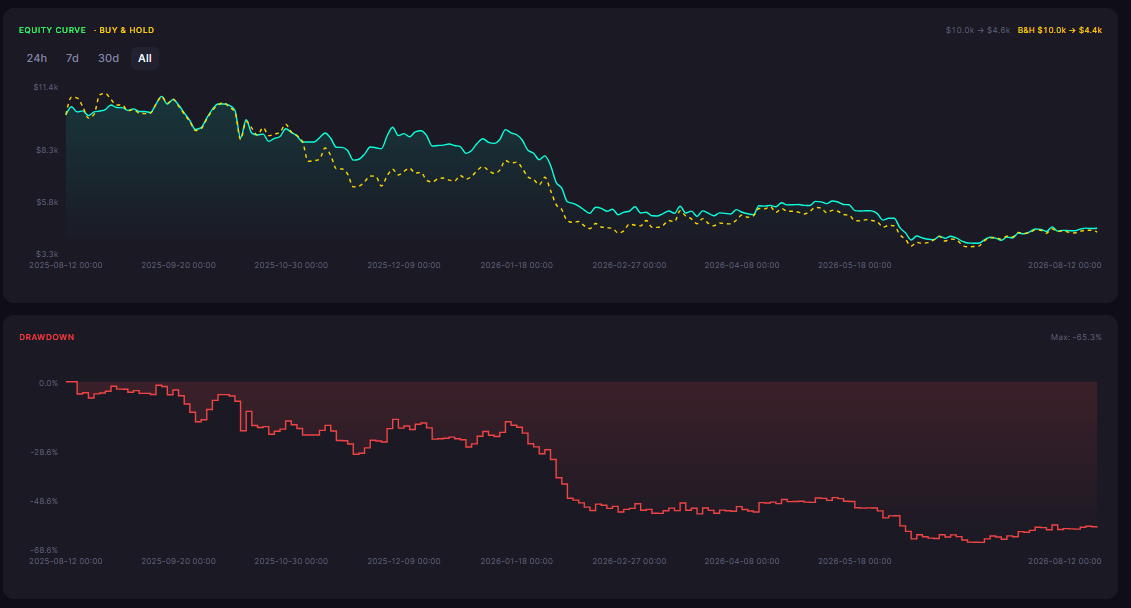
The structure of the losses is the story. The average loss ($208.86) exceeds the average win ($162.00), and the win rate is below 50%. That combination is a negative-expectancy machine: the strategy was wrong more than half the time and lost more on each losing trade than it gained on each winner. Holding a position 78.8% of the time means it was also exposed to nearly every drawdown in the window.
Daily Timeframe: 35 Trades, -27.23%
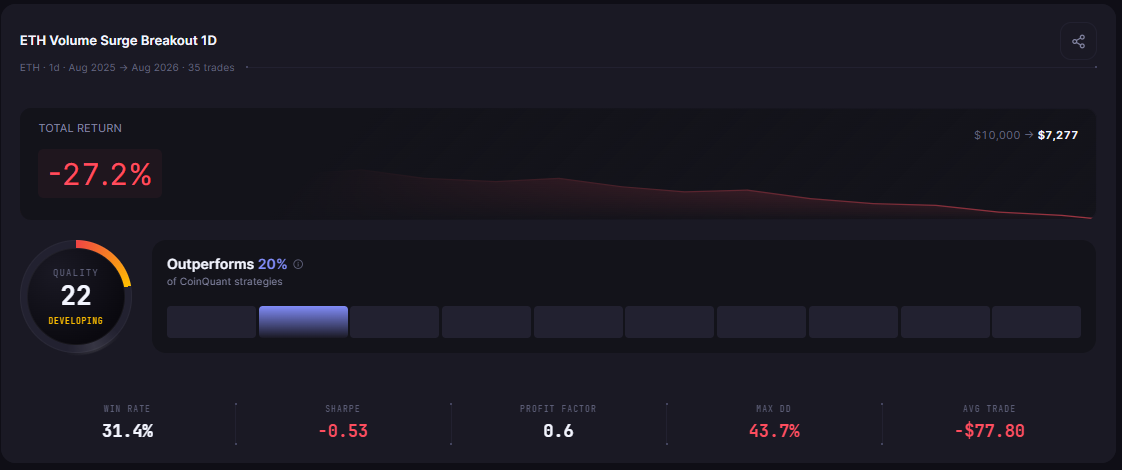
The daily version traded far less: 35 trades, in the market 43.2% of the time. It still lost money, with a total return of -27.23%: $10,000 became $7,277.
| Metric | Result |
|---|---|
| Total Return | -27.23% ($10,000 to $7,277) |
| Total Trades | 35 |
| Win Rate | 31.4% |
| Profit Factor | 0.60 |
| Sharpe Ratio | -0.53 |
| Max Drawdown | 43.7% |
| Average Win | $373.81 |
| Average Loss | $284.78 |
| Best Trade | +$1,005.42 |
| Worst Trade | -$822.43 |
| Time in Market | 43.2% |
| Total Fees | $117.39 |
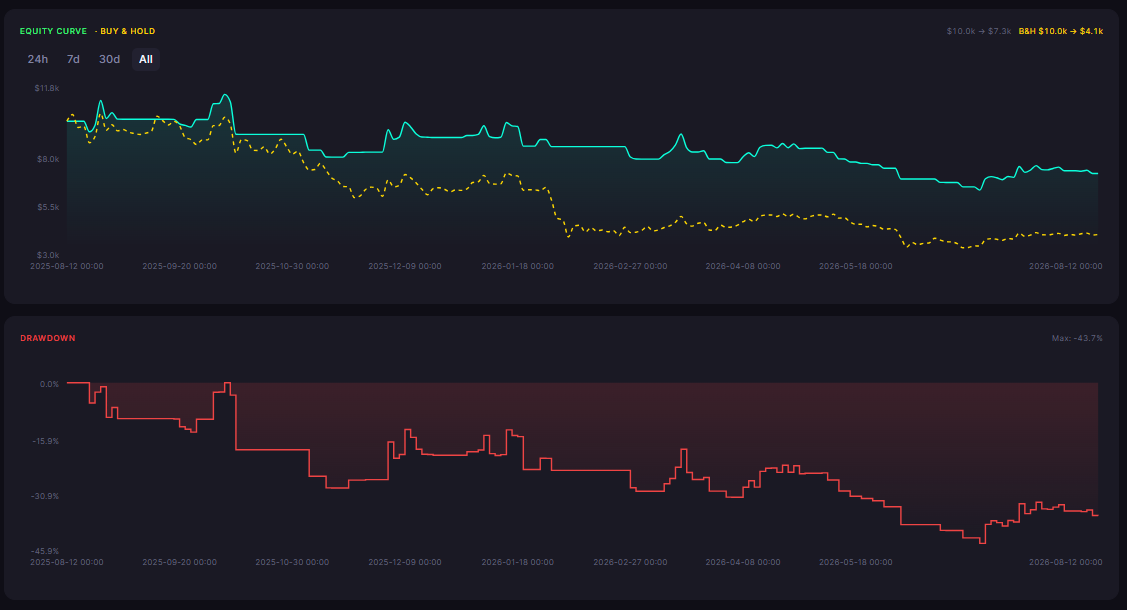
The daily version had a healthier payoff ratio: the average win ($373.81) exceeded the average loss ($284.78). But with only 31.4% of trades profitable, the winners could not overcome the losers. A win rate near one in three is the signature of a strategy that enters too often and cuts winners on the 20-period exit before they run.
Does a Volume Breakout Strategy Predict Ethereum Breakouts?
The honest answer from these two backtests: not in a way that survives fees and slippage. A volume breakout strategy built on the 20-period average lost money on both timeframes.
The volume surge signal produced negative returns on both timeframes. The 4H version lost because it was in the market almost constantly and paid fees on 97 round trips. The 1D version lost because its win rate collapsed to 31.4% while the strategy still churned through 35 trades.
Volume Surge vs Simply Holding Ethereum
A losing strategy can still answer a useful question: did it lose less than doing nothing? In this 12-month window, Ethereum itself fell hard. Buy-and-hold ETH turned $10,000 into $4,395 on the 4H window and into $4,104 on the 1D window.
| Approach | Final Balance | Outcome vs Buy-and-Hold |
|---|---|---|
| ETH Volume Surge Breakout 4H | $4,575 | Beat buy-and-hold by $180 |
| ETH Volume Surge Breakout 1D | $7,277 | Beat buy-and-hold by $3,173 |
| Buy and hold ETH (4H window) | $4,395 | Baseline |
| Buy and hold ETH (1D window) | $4,104 | Baseline |
Both strategy versions beat simply holding Ethereum, and the daily version beat it by a wide margin: $7,277 versus $4,104. That is the honest silver lining of a negative result. In a falling market, the strategy's exits kept it out of the worst of the decline, even though its entries were not good enough to turn a profit.
The distinction matters. Beating buy-and-hold in a bear window is real evidence that the exit logic works. It is not evidence that the entry logic works. A strategy that loses 27% while the asset loses 59% has half a strategy: it knows when to leave, but not when to arrive.
The deeper finding is about the signal itself. A volume spike above the 20-period average happens often in a trending asset like Ethereum. Most spikes are not breakouts; they are participation in moves that reverse. The strategy as tested has no way to distinguish the two, and the data says the distinction is where the edge would have to come from. This runs parallel to our earlier test of the same family on Ethereum, the volume surge strategy backtest.
The Practical Lesson
This is a negative result with a positive use: it shows exactly where a volume breakout strategy needs work.
A trader iterating on this idea would test a volume threshold (spike of 2x or 3x the average instead of any cross), a trend filter (only take volume breakouts when price is already above the 200-period average), or a tighter exit. Each change needs its own backtest. That iteration loop, run before risking capital, is the entire point of backtesting a volume breakout strategy before trading it live.
The strategy library on CoinQuant contains the exact tested versions: ETH Volume Surge Breakout 4H and ETH Volume Surge Breakout 1D. You can load either one, change a condition, and re-run the full 12 months in minutes.
Disclaimer:
Key Takeaway
