
Backtest Results
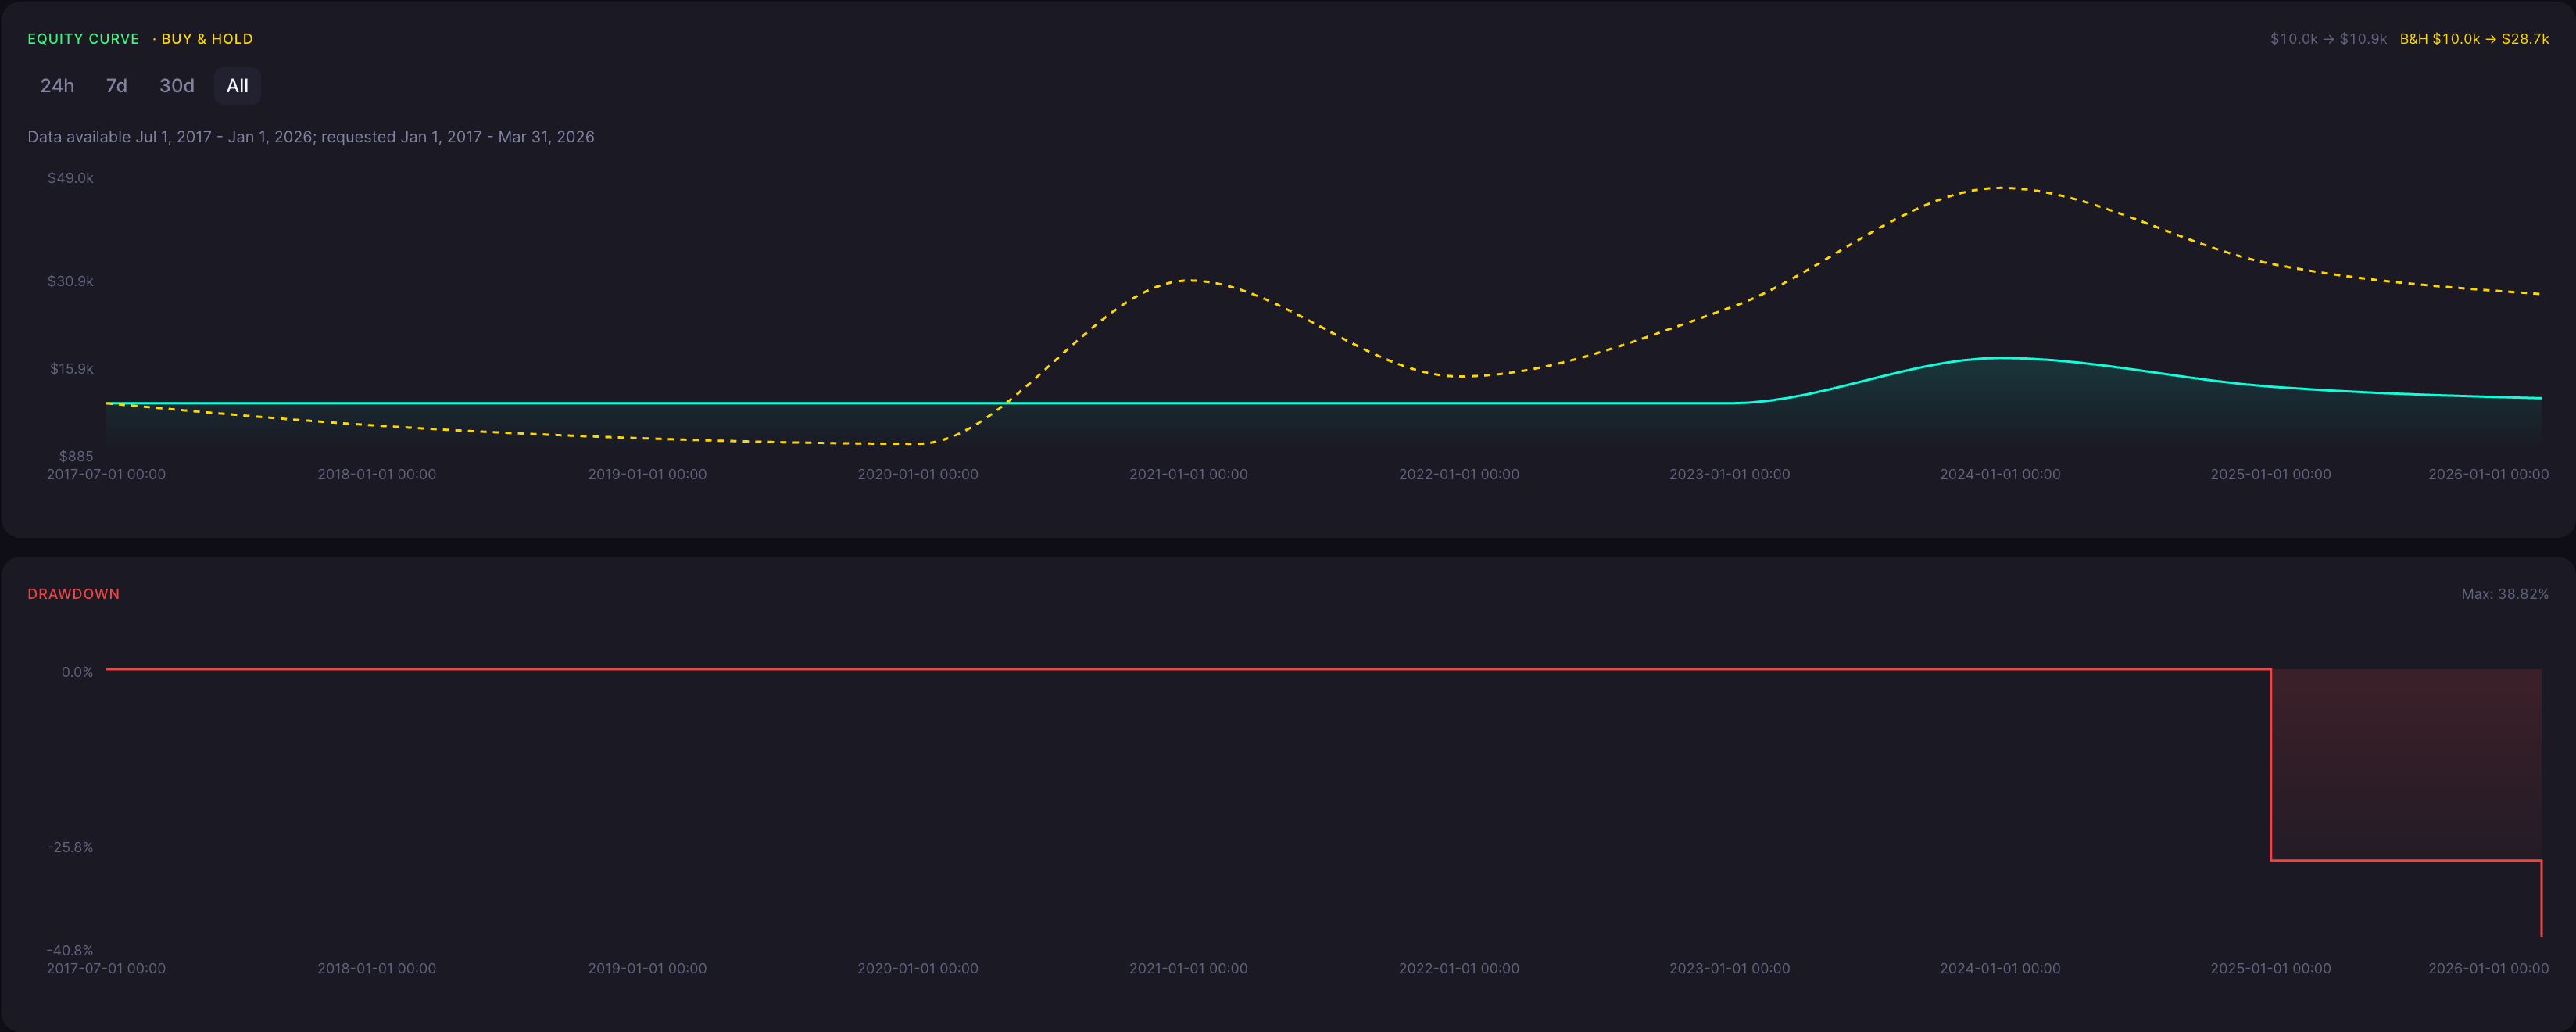
The historical test covers 1 Jul 2017 to 1 Jan 2026 and applies a weighted moving average crossover to six-month ETH/USDT candles. It recorded 1 trade, a return of 8.66%, and a final balance of 10,865.83 USDT from 10,000.00 USDT. The drawdown helps put that positive ending result in perspective.
ROI
8.66%
Win Rate
100.00%
Max DD
38.82%
Sharpe
0.15
Profit Factor
N/A
Total Trades
1
Backtest insights
A return of 8.66% left the account above its starting value, but the maximum drawdown reached 38.82%. That decline matters even though the reported win rate is 100.00%. With just 1 trade, the win rate cannot establish a dependable pattern of success. Profit factor is N/A in the supplied results. The outcome offers a historical example of these rules, not a reliable estimate of how frequently future trades would win.

Performance may vary depending on market conditions. During trending periods, the strategy may behave differently compared to ranging markets, impacting both returns and drawdowns.
How the Weighted Moving Average(10) Crossover Strategy Works
What It Is
This approach compares ETH/USDT closing prices with a 10-period Weighted Moving Average on six-month candles. Newer closes have greater influence on the average. The purpose is to follow broad price direction through a consistent set of holding rules.
How Signals Are Generated
The indicator uses Close as its source. A crossing above the 10-period Weighted Moving Average opens a long position; a crossing below it closes that position. The strategy does not open short positions when the price moves below the average.
When It Works Best
An extended directional move may allow a long position to remain open while prices rise. This is the intended trend-following behavior, rather than a market pattern demonstrated reliably by the trade sample here.
When It Performs Poorly
Repeated reversals around the average can undermine the signals. Six-month candles also delay opportunities to respond to changing conditions, potentially leaving a position exposed during declines. A long measurement period does not make the strategy low risk.
Strengths

A simple price crossing determines each entry and exit.
The weighted average emphasizes more recent closing prices.
Long-only rules avoid taking short positions.
Limitations

Only 1 trade is too little to establish consistency.
Six-month candles offer very few signal observations.
A 100.00% win rate does not remove the risk shown by the drawdown.
Why Use CoinQuant Instead of Manual Trading or Other Platforms
Choosing the right way to test and execute trading strategies is critical. Below is a comparison between CoinQuant, manual trading, and other platforms to highlight key differences in speed, accuracy, and usability.
CoinQuant is designed specifically for traders who want to validate strategies quickly and reliably without coding. Unlike manual trading or traditional platforms, it allows you to test multiple scenarios, analyze performance instantly, and iterate faster using real data.
Frequently asked questions
How does the Weighted Moving Average(10) Crossover strategy perform on ETH/USDT in the 6 Month timeframe?
The performance of the Weighted Moving Average(10) Crossover strategy on ETH/USDT in the 6 Month timeframe depends on market conditions. Based on the backtest results above, it achieved a return of 8.66% with a maximum drawdown of 38.82%. Results may vary depending on volatility and overall market trends.
Is the Weighted Moving Average(10) Crossover strategy reliable for trading ETH/USDT?
The Weighted Moving Average(10) Crossover strategy can be effective when used in the right conditions. For ETH/USDT, it typically performs well in sustained directional trends but may underperform during sideways or rapidly reversing markets. Backtesting helps evaluate its reliability before applying it in live trading.
Why is backtesting important for trading strategies?
Backtesting allows traders to evaluate how a strategy would have performed using historical data. It helps identify strengths, weaknesses, and risk levels before applying the strategy in real markets, reducing the likelihood of unexpected losses.
How can I test the Weighted Moving Average(10) Crossover strategy on CoinQuant?
You can use CoinQuant to build and backtest the Weighted Moving Average(10) Crossover strategy without coding. Simply select your asset, define your strategy rules, and run a backtest to view detailed performance metrics instantly.
What are the best settings for the Weighted Moving Average(10) Crossover strategy on 6 Month?
The best settings for the Weighted Moving Average(10) Crossover strategy depend on the asset and timeframe. Traders often adjust parameters based on volatility and trading style. Using a backtesting platform like CoinQuant allows you to test different configurations and identify what works best.