
Backtest Results
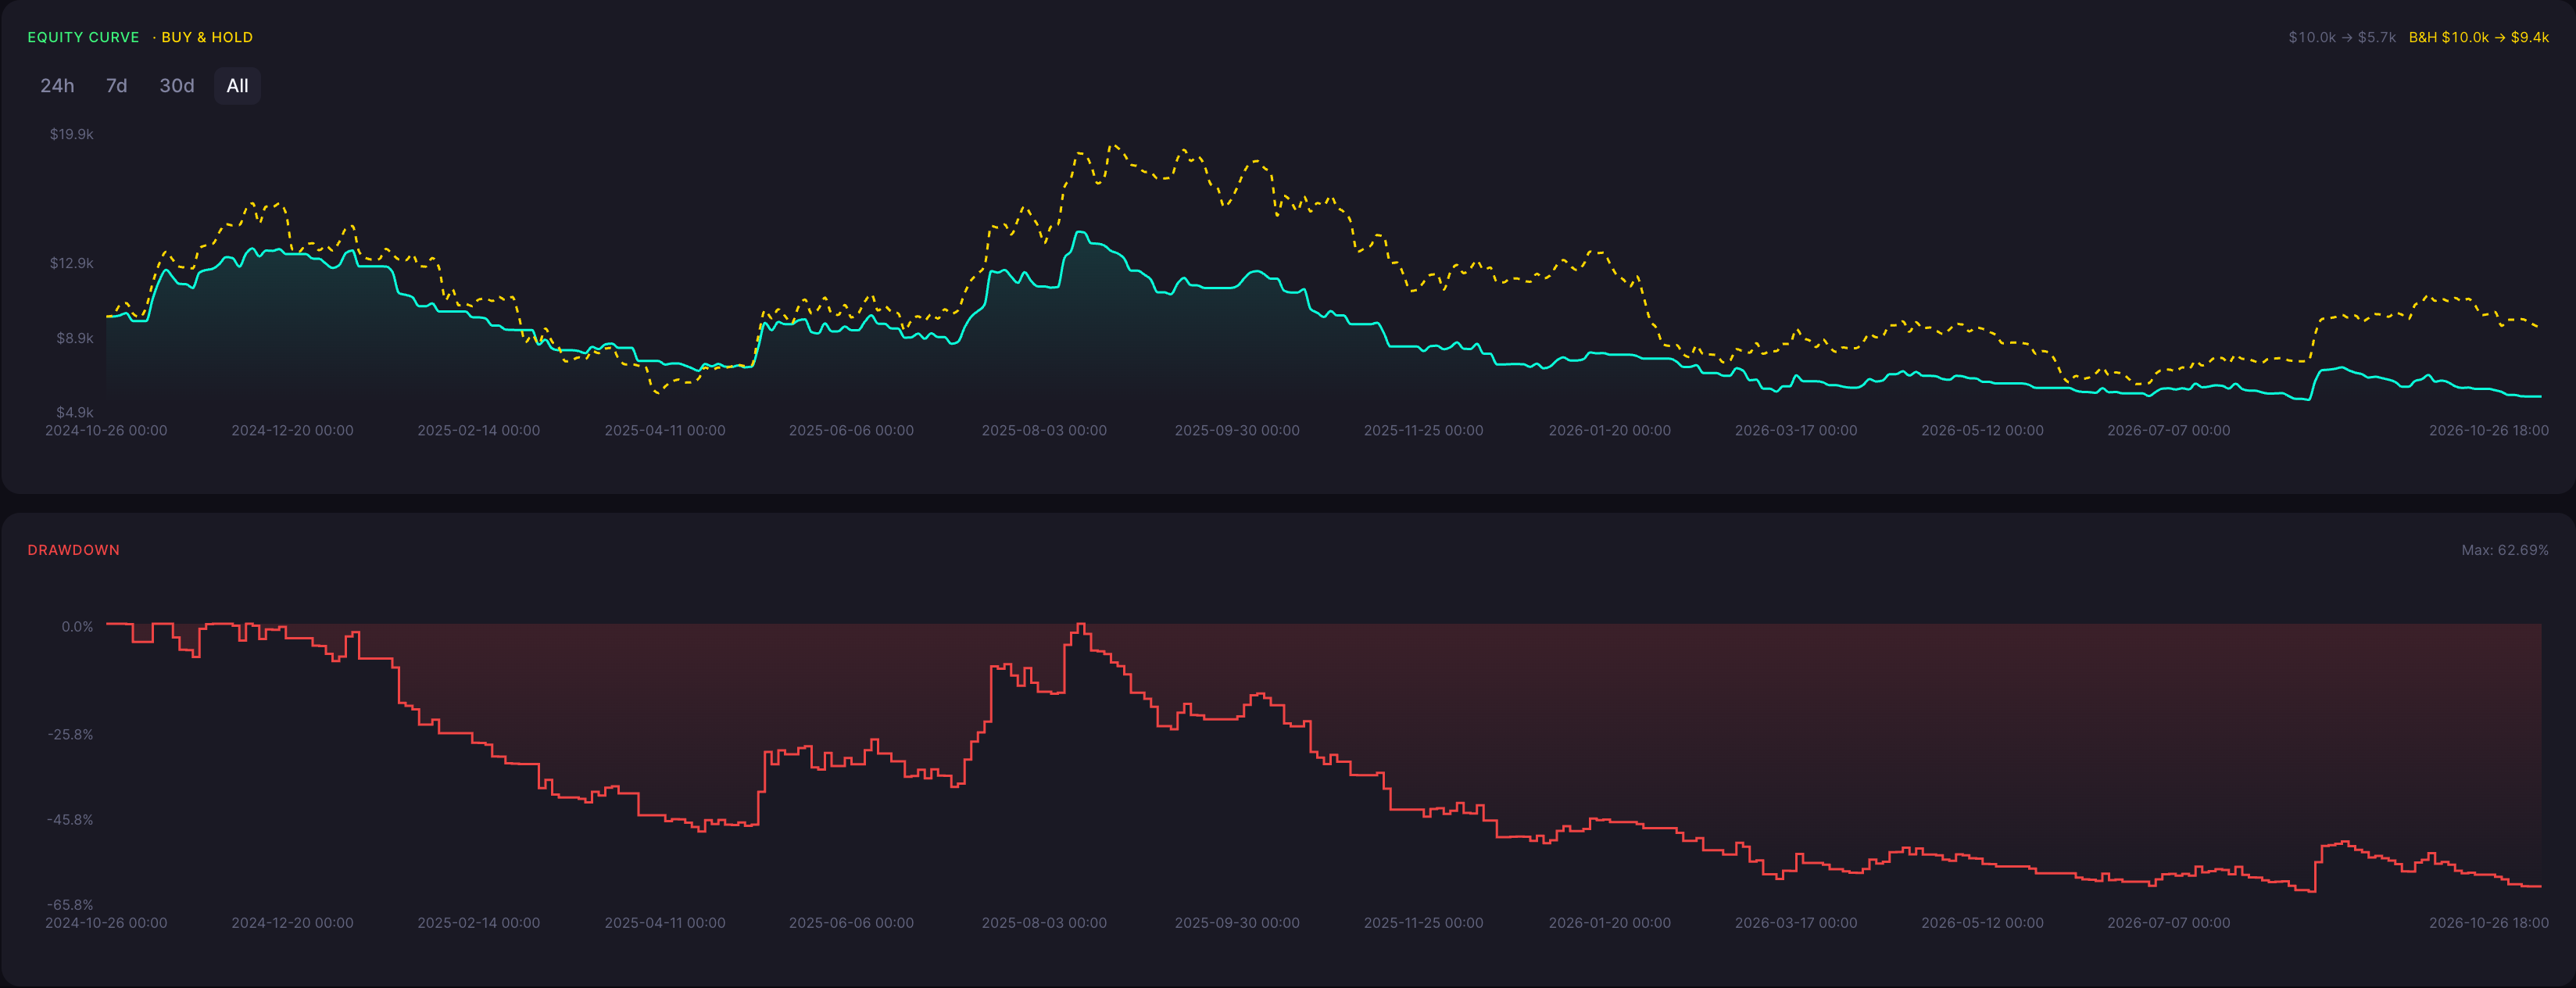
The strategy balance finished at 5,725.00 USDT from 10,000.00 USDT of starting capital, with a return of -42.75%. The test ran from 26 Oct 2024 to 26 Oct 2026. The test used price data from 26 Oct 2024 to 26 Oct 2026. These details do not confirm that the price history was complete and unbroken, or establish a documented process for preparing the indicators at the start of the test.
ROI
-42.75%
Win Rate
20.81%
Max DD
62.69%
Sharpe
-0.38
Profit Factor
0.83
Total Trades
197
Backtest insights
A -42.75% return and 62.69% maximum drawdown make the loss and historical risk central to this result. The run recorded 197 trades, a 20.81% win rate and a 0.83 profit factor. Those figures summarize observed outcomes; they do not explain the losses or validate the strategy for future use. The final balance of 5,725.00 USDT should be read with the open questions about how the strategy was built and about trading costs in mind. Neither the trade count nor the sampled performance history proves that every crossing was executed.

Performance may vary depending on market conditions. During trending periods, the strategy may behave differently compared to ranging markets, impacting both returns and drawdowns.
How the RMA Strategy Works
What It Is
This setup requested a Running Moving Average using period 10 and the Close source. In the saved strategy, the series is named RelativeMovingAverage, with period 10 and Close source.
The requested and saved names are disclosed separately because their mathematical equivalence has not been proven. This page does not confirm the exact formula behind the indicator or how it was set up at the start of the test.
Acceptance of the disclosed 72-field difference class was an acceptance of risk, not a finding that the implementations are equivalent. It also does not demonstrate that generic oscillator or divergence controls are inert. Those saved controls are not described here as additional requested RSI or divergence signals.
How Signals Are Generated
The primary rules compare the six-hour Close with the saved moving-average series:
Enter long: Close crosses above RelativeMovingAverage, using action enter_long.
Exit long: Close crosses below RelativeMovingAverage, using action exit_long.
Execution type: Market orders for entry and exit.
The requested strategy is long-only and specifies no extra conditions, filters, stops, targets or shorts. Both comparison series use the 6h timeframe.
Saved execution and signal-control fields remain part of the configuration. The crossing rules therefore describe the intended entry and exit signals, not a checked one-to-one record of crossings and executed trades. A full record matching each signal to each trade is not provided.
When It Works Best
General moving-average theory suggests that a crossing approach may be more useful when a directional move persists after the entry signal. That expectation was not measured in this run. The aggregate metrics do not establish which conditions favored the strategy or whether a particular regime was present.
When It Performs Poorly
As general theory, frequent changes in direction near the average and the delay inherent in a historical-price signal can create difficulties for a crossing strategy. These effects were not measured in this run. They are not established explanations for the recorded loss, trade count or drawdown.
Strengths

Explicit Close-versus-average crossing rules make the primary signal definition inspectable.
The period-10, Close-source request fixes the stated indicator parameters for review.
A long-only design with a disclosed current-equity allocation basis makes the intended exposure structure clear.
Limitations

The substantial loss comes from one historical run; it proves neither a causal explanation nor regime behavior, signal completeness, live reliability or future performance.
Trading fee rates and slippage were not provided, so costs are unknown, not zero. It is not known whether costs were included, and the reported fee total does not show that fees caused the loss.
It is not confirmed that the Relative Moving Average used matches the Running Moving Average described in the strategy, that unused settings had no effect, or how the indicator was set up at the start. The trade dates and counts do not show that the price history was complete and unbroken.
Why Use CoinQuant Instead of Manual Trading or Other Platforms
Choosing the right way to test and execute trading strategies is critical. Below is a comparison between CoinQuant, manual trading, and other platforms to highlight key differences in speed, accuracy, and usability.
CoinQuant is designed specifically for traders who want to validate strategies quickly and reliably without coding. Unlike manual trading or traditional platforms, it allows you to test multiple scenarios, analyze performance instantly, and iterate faster using real data.
Frequently asked questions
How does the RMA strategy perform on ETH in the 6 hour timeframe?
The performance of the RMA strategy on ETH in the 6 hour timeframe depends on market conditions. Based on the backtest results above, it achieved a return of -42.75% with a maximum drawdown of 62.69%. Results may vary depending on volatility and overall market trends.
Is the RMA strategy reliable for trading ETH?
The RMA strategy can be effective when used in the right conditions. For ETH, it typically performs well in sustained directional trends (general theory, not measured in this run) but may underperform during choppy or sideways markets (general theory, not measured in this run). Backtesting helps evaluate its reliability before applying it in live trading.
Why is backtesting important for trading strategies?
Backtesting allows traders to evaluate how a strategy would have performed using historical data. It helps identify strengths, weaknesses, and risk levels before applying the strategy in real markets, reducing the likelihood of unexpected losses.
How can I test the RMA strategy on CoinQuant?
You can use CoinQuant to build and backtest the RMA strategy without coding. Simply select your asset, define your strategy rules, and run a backtest to view detailed performance metrics instantly.
What are the best settings for the RMA strategy on 6 hour?
The best settings for the RMA strategy depend on the asset and timeframe. Traders often adjust parameters based on volatility and trading style. Using a backtesting platform like CoinQuant allows you to test different configurations and identify what works best.