
Backtest Results
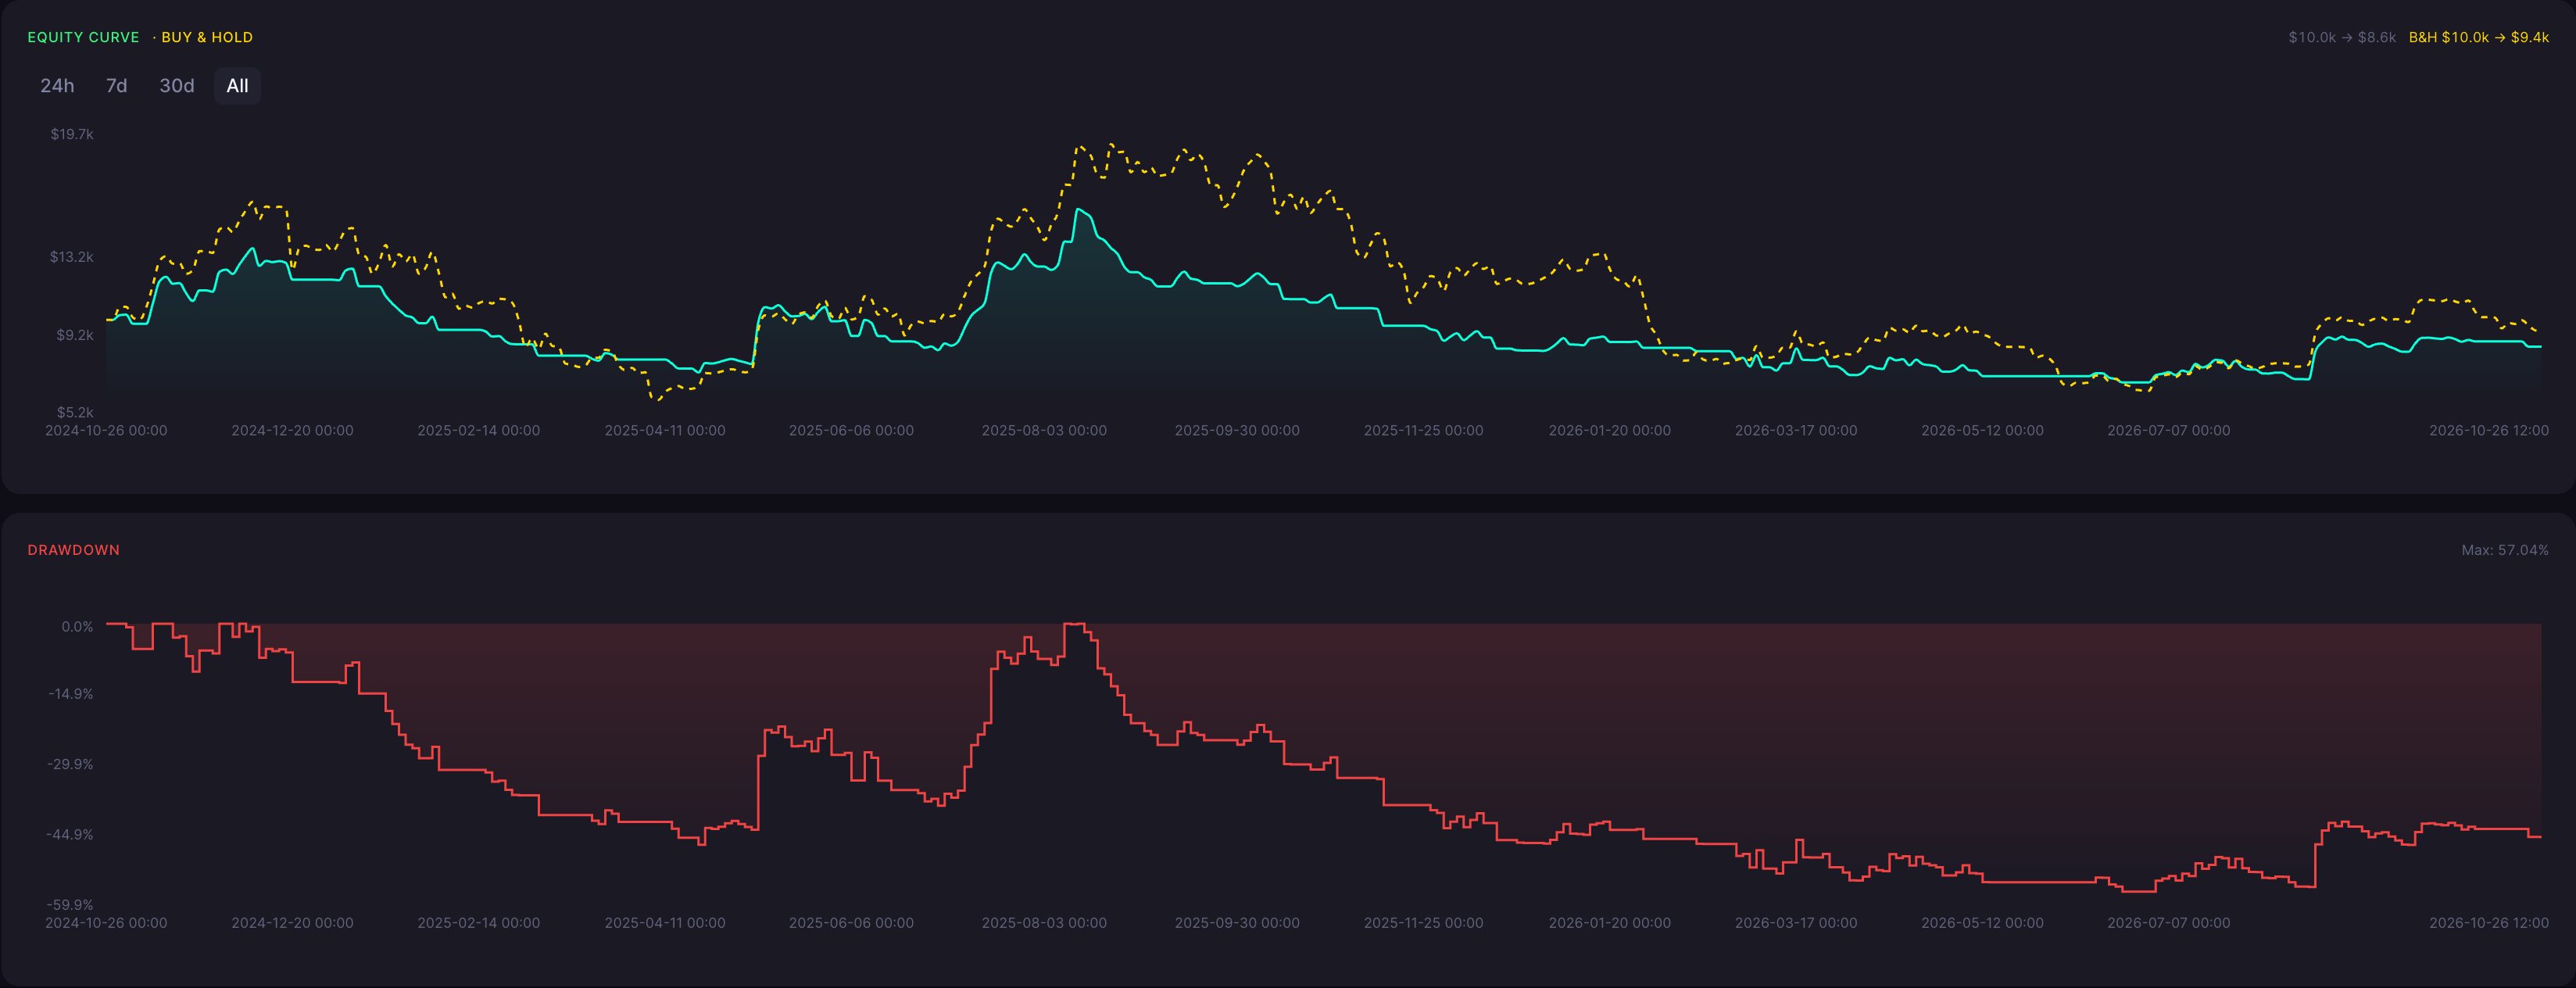
These results come from one CoinQuant backtest of ETHUSDT spot on 12 hour candles. The test ran from 26 Oct 2024 to 26 Oct 2026. Price data covered 26 Oct 2024 to 26 Oct 2026, a slightly shorter period than planned. The test did not flag a shortened date range or any problems. This does not confirm that the price history was complete and unbroken. Over this window the strategy recorded 99 trades, a -13.76% total return and a 57.04% maximum drawdown.
ROI
-13.76%
Win Rate
23.23%
Max DD
57.04%
Sharpe
0.06
Profit Factor
0.93
Total Trades
99
Backtest insights
Across 99 trades, this 12 hour run ended with a total return of -13.76%, so the strategy finished below its starting capital. The win rate was 23.23%, and the profit factor of 0.93 is under 1, which means gross losses outweighed gross profits in this test. The maximum drawdown reached 57.04%, a large peak-to-trough decline. The Sharpe ratio of 0.06 was close to zero. This is one historical run, and it does not explain why these outcomes occurred.

Performance may vary depending on market conditions. During trending periods, the strategy may behave differently compared to ranging markets, impacting both returns and drawdowns.
How the RMA Strategy Works
What It Is
The strategy request named a Running Moving Average (RMA) with a 10-period length on the Close price. The saved CoinQuant strategy records the indicator as RelativeMovingAverage, with period 10 and price type close. This page does not confirm that the Relative Moving Average used matches the Running Moving Average described in the strategy, and how the indicator was set up at the start is not documented here.
How Signals Are Generated
The rules compare the 12 hour Close with the 10-period average:
Entry: when Close crosses above the RelativeMovingAverage (period 10, Close), the strategy opens a long position (enter_long) with a market order.
Exit: when Close crosses below the RelativeMovingAverage (period 10, Close), the strategy closes the long position (exit_long) with a market order.
The strategy is long-only and allows one open entry at a time. The saved conditions also contain extra fields, such as debounce_bars set to 5 and wait_for_confirmation set to true, whose effect on this crossover rule is not documented. For that reason, this page does not claim that every crossing became a trade.
When It Works Best
General theory, not measured in this run: price and moving average crossover rules tend to suit markets that move in sustained, directional trends. In those conditions, price can stay on one side of the average for a long stretch, giving a long position room to follow the move.
When It Performs Poorly
General theory, not measured in this run: in sideways or choppy markets, price can cross back and forth over the average, which may lead to frequent entries and exits that give back gains. This backtest does not show whether that happened here.
Strengths

Clear, rule-based entries and exits built on a single price versus average crossover, so the logic is easy to read and repeat.
A simple position structure: long-only, one open position at a time, sized at 100% of current equity.
One main parameter, a 10-period length on Close, which makes the setup straightforward to re-test on other lengths or timeframes.
Limitations

These figures come from one historical run that lost money, with a -13.76% total return, a 57.04% maximum drawdown and a 23.23% win rate. A single run gives no measured view of which market phases helped or hurt, and it does not guarantee future results.
Trading costs are unknown, not zero. Trading fee rates and slippage were not provided, so it is not known whether trading costs were included or left out.
The request named a Running Moving Average, but the saved indicator is RelativeMovingAverage (period 10, Close), and formula equivalence is not proven. The saved settings also differ from the original request in 72 fields, including general oscillator and divergence controls. This is accepted as a disclosed risk; those controls have not been shown to be inactive. How the indicator was set up at the start is not documented, and bar counts and dates do not show that the price history was complete and unbroken.
Why Use CoinQuant Instead of Manual Trading or Other Platforms
Choosing the right way to test and execute trading strategies is critical. Below is a comparison between CoinQuant, manual trading, and other platforms to highlight key differences in speed, accuracy, and usability.
CoinQuant is designed specifically for traders who want to validate strategies quickly and reliably without coding. Unlike manual trading or traditional platforms, it allows you to test multiple scenarios, analyze performance instantly, and iterate faster using real data.
Frequently asked questions
How does the RMA strategy perform on ETH in the 12 hour timeframe?
The performance of the RMA strategy on ETH in the 12 hour timeframe depends on market conditions. Based on the backtest results above, it achieved a return of -13.76% with a maximum drawdown of 57.04%. Results may vary depending on volatility and overall market trends.
Is the RMA strategy reliable for trading ETH?
The RMA strategy can be effective when used in the right conditions. For ETH, it typically performs well in sustained directional trends (general theory, not measured in this run) but may underperform during choppy or sideways markets (general theory, not measured in this run). Backtesting helps evaluate its reliability before applying it in live trading.
Why is backtesting important for trading strategies?
Backtesting allows traders to evaluate how a strategy would have performed using historical data. It helps identify strengths, weaknesses, and risk levels before applying the strategy in real markets, reducing the likelihood of unexpected losses.
How can I test the RMA strategy on CoinQuant?
You can use CoinQuant to build and backtest the RMA strategy without coding. Simply select your asset, define your strategy rules, and run a backtest to view detailed performance metrics instantly.
What are the best settings for the RMA strategy on 12 hour?
The best settings for the RMA strategy depend on the asset and timeframe. Traders often adjust parameters based on volatility and trading style. Using a backtesting platform like CoinQuant allows you to test different configurations and identify what works best.