
Backtest Results
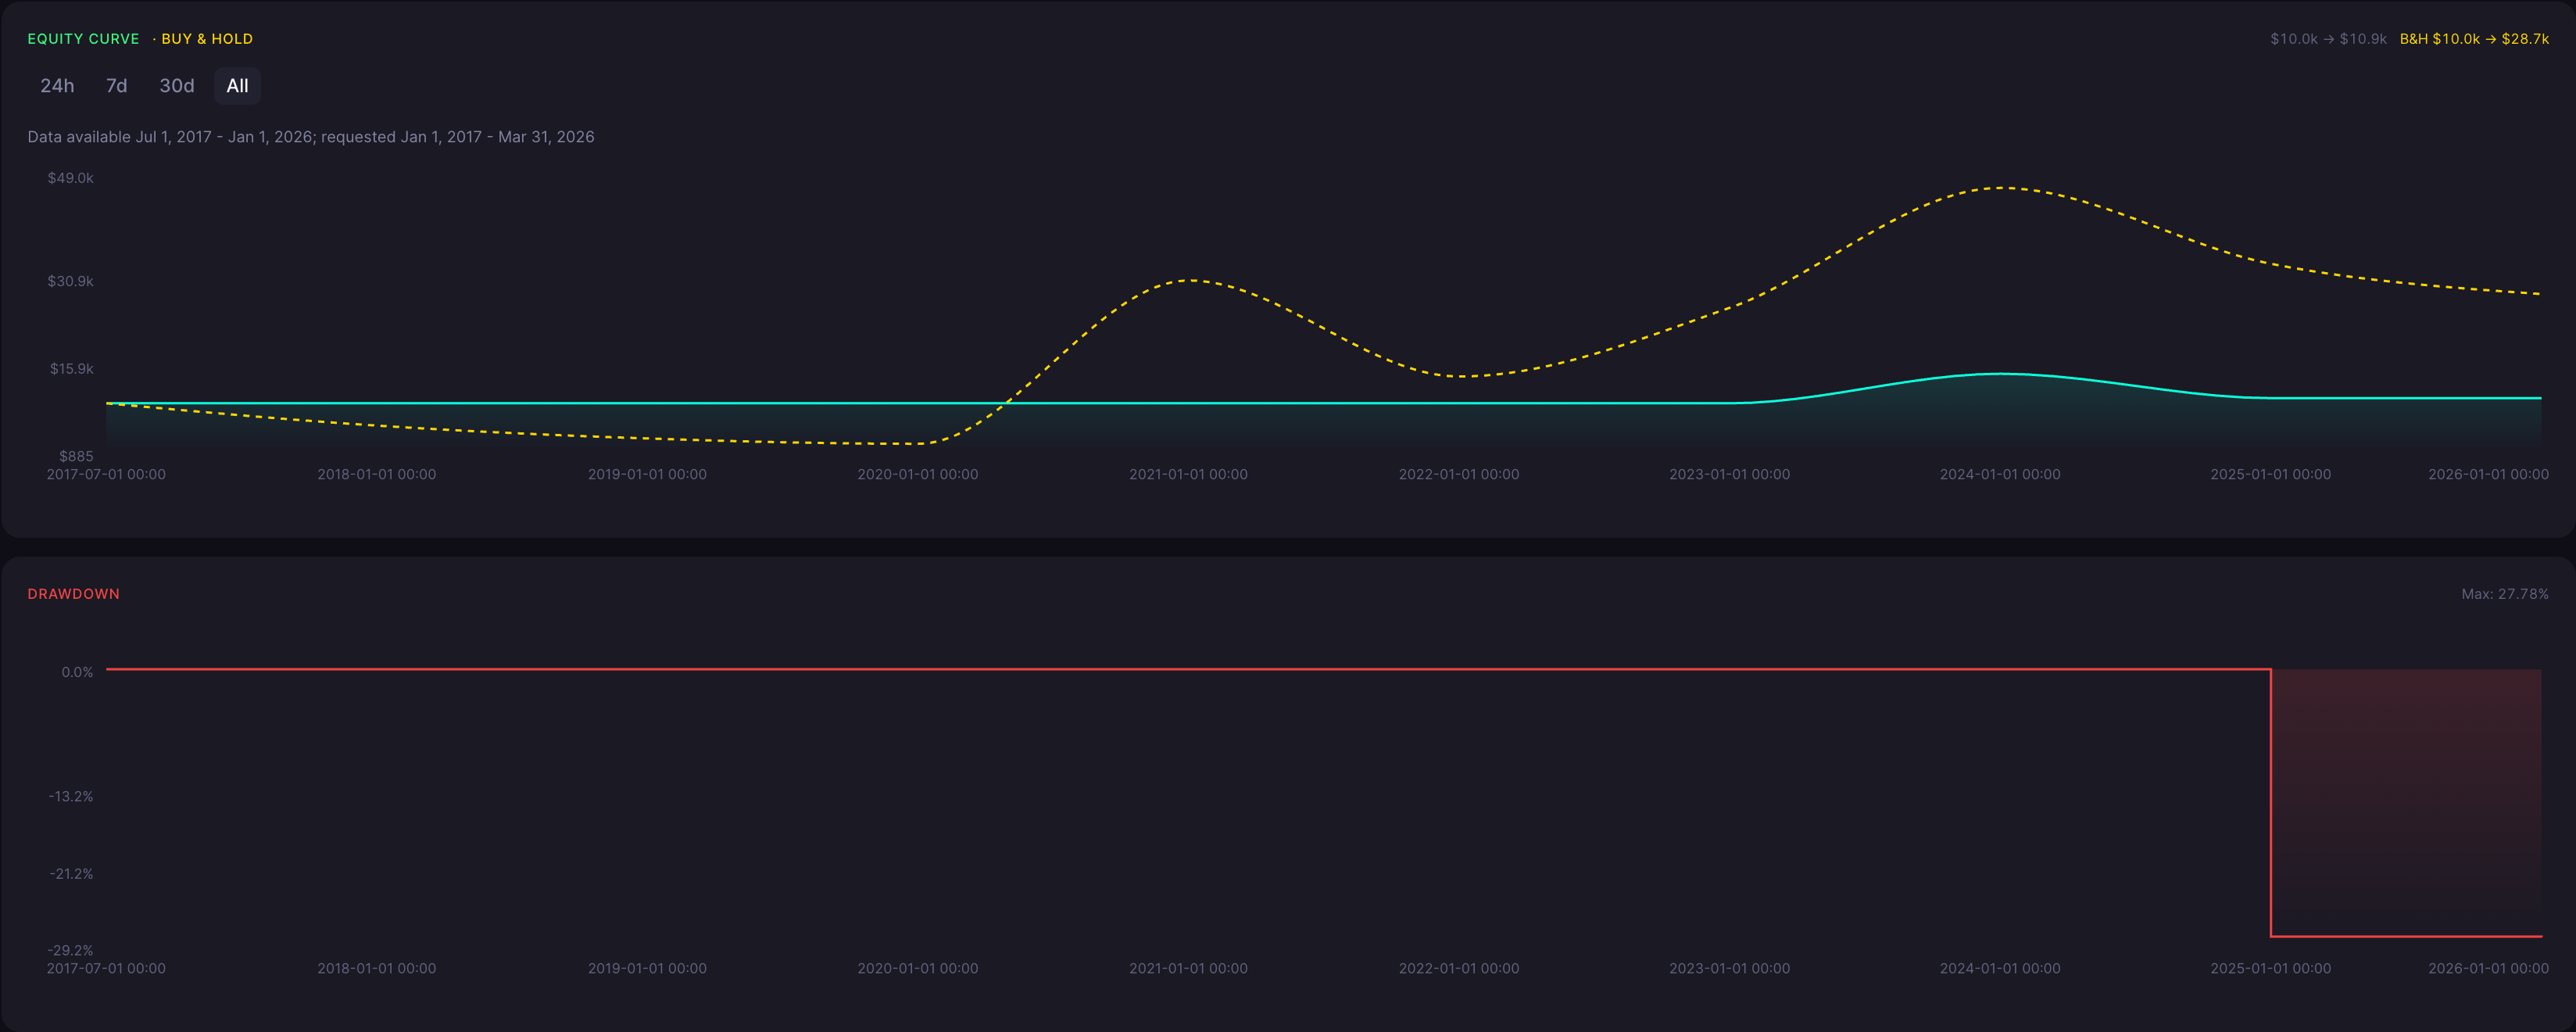
This six-month ETH/USDT test applied Hull Moving Average crossing rules over 1 Jul 2017 to 1 Jan 2026. It ended at 10,870.44 USDT from starting capital of 10,000.00 USDT, a return of 8.70%. With 1 trade recorded, the results describe a narrow trading sample despite the length of the historical period.
ROI
8.70%
Win Rate
100.00%
Max DD
27.78%
Sharpe
0.13
Profit Factor
N/A
Total Trades
1
Backtest insights
The account gained 8.70% over the test, while maximum drawdown reached 27.78%. A positive ending balance therefore did not mean an uninterrupted rise. The 100.00% win rate comes from only 1 trade and cannot support a conclusion about dependable winning frequency. Profit factor is N/A in these results. The figures show the outcome of this historical run, but offer little basis for judging consistency or the likely result of another test period.

Performance may vary depending on market conditions. During trending periods, the strategy may behave differently compared to ranging markets, impacting both returns and drawdowns.
How the Hull Moving Average(10) Crossover Strategy Works
What It Is
A Hull Moving Average smooths prices using a combination of weighted averages, aiming to reduce delay. This version uses 10 periods of six-month ETH/USDT candles. The line acts as a guide for holding or closing a long position.
How Signals Are Generated
The calculation uses Close as its source. Close crossing above the 10-period Hull Moving Average triggers a long entry. Close crossing below the same average triggers the exit. Moving below the line does not create a short position.
When It Works Best
Sustained directional trends can suit rules that remain invested until an opposite crossing. This is a general expectation of the approach, not a dependable finding from the small number of trades in this run.
When It Performs Poorly
Rapid changes in direction can turn a fresh entry into a losing position. Sideways prices can also produce misleading crossings. Six-month candles leave long intervals between observations, so the indicator's responsiveness does not ensure a timely exit.
Strengths

The indicator aims to smooth prices without excessive delay.
Entries and exits follow separate, clearly stated crossings.
A fixed price source keeps the signal definition consistent.
Limitations

Only 1 trade cannot demonstrate repeatability.
Six-month candles give a very limited view of signal behavior.
The reported win rate does not measure the size of declines while invested.
Why Use CoinQuant Instead of Manual Trading or Other Platforms
Choosing the right way to test and execute trading strategies is critical. Below is a comparison between CoinQuant, manual trading, and other platforms to highlight key differences in speed, accuracy, and usability.
CoinQuant is designed specifically for traders who want to validate strategies quickly and reliably without coding. Unlike manual trading or traditional platforms, it allows you to test multiple scenarios, analyze performance instantly, and iterate faster using real data.
Frequently asked questions
How does the Hull Moving Average(10) Crossover strategy perform on ETH/USDT in the 6 Month timeframe?
The performance of the Hull Moving Average(10) Crossover strategy on ETH/USDT in the 6 Month timeframe depends on market conditions. Based on the backtest results above, it achieved a return of 8.70% with a maximum drawdown of 27.78%. Results may vary depending on volatility and overall market trends.
Is the Hull Moving Average(10) Crossover strategy reliable for trading ETH/USDT?
The Hull Moving Average(10) Crossover strategy can be effective when used in the right conditions. For ETH/USDT, it typically performs well in sustained directional trends but may underperform during sideways or rapidly reversing markets. Backtesting helps evaluate its reliability before applying it in live trading.
Why is backtesting important for trading strategies?
Backtesting allows traders to evaluate how a strategy would have performed using historical data. It helps identify strengths, weaknesses, and risk levels before applying the strategy in real markets, reducing the likelihood of unexpected losses.
How can I test the Hull Moving Average(10) Crossover strategy on CoinQuant?
You can use CoinQuant to build and backtest the Hull Moving Average(10) Crossover strategy without coding. Simply select your asset, define your strategy rules, and run a backtest to view detailed performance metrics instantly.
What are the best settings for the Hull Moving Average(10) Crossover strategy on 6 Month?
The best settings for the Hull Moving Average(10) Crossover strategy depend on the asset and timeframe. Traders often adjust parameters based on volatility and trading style. Using a backtesting platform like CoinQuant allows you to test different configurations and identify what works best.