
Backtest Results
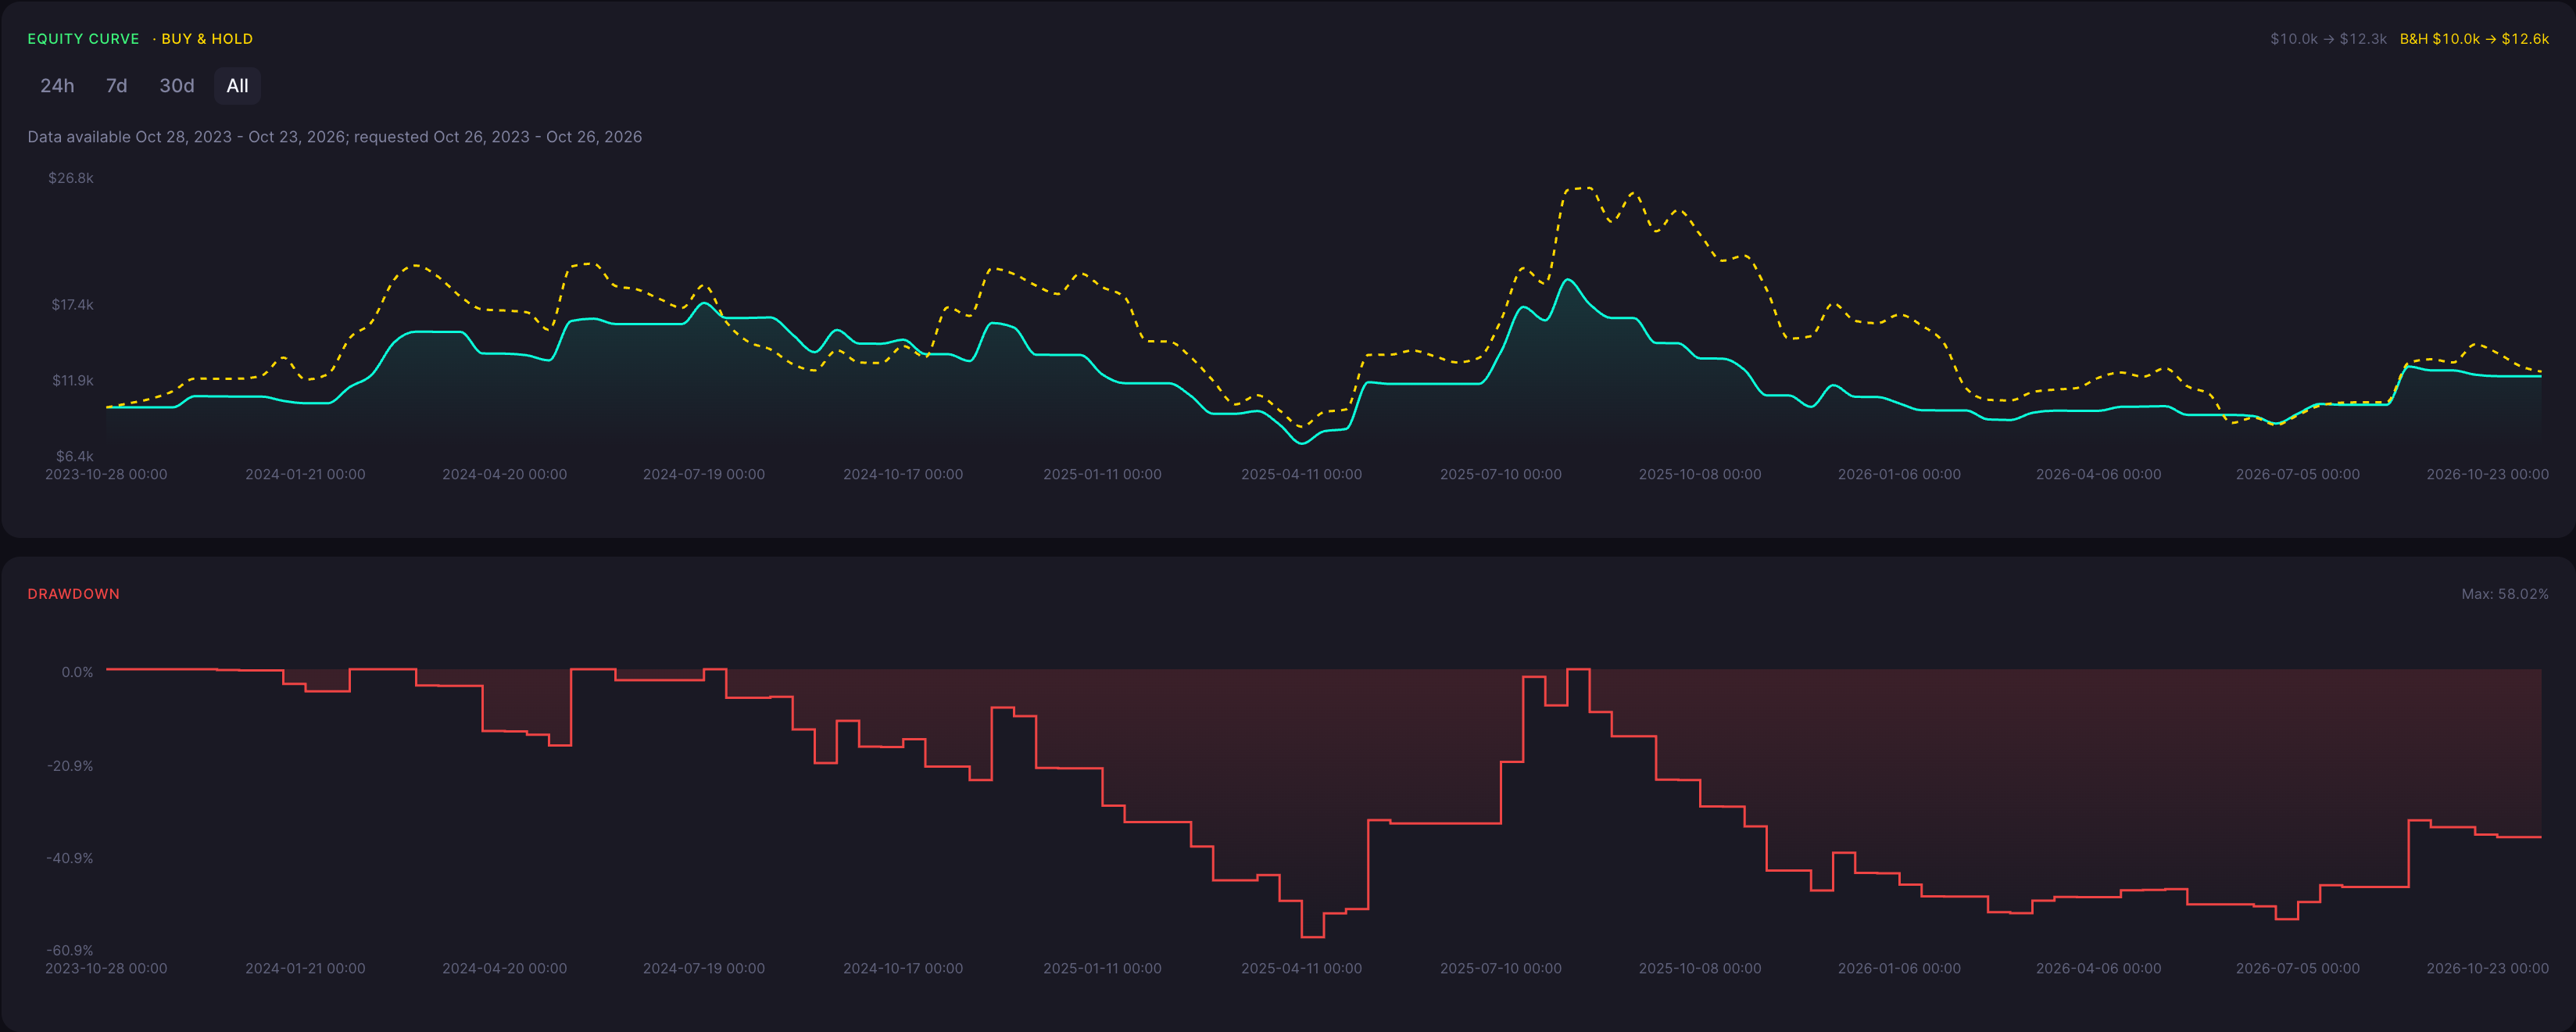
Total return: 22.60% over 31 trades. Test dates: 28 Oct 2023 to 23 Oct 2026. Available test dates: 28 Oct 2023 to 23 Oct 2026. Available market data made the test dates shorter than planned, so the results cover only the shorter period.
ROI
22.60%
Win Rate
38.71%
Max DD
58.02%
Sharpe
0.37
Profit Factor
1.10
Total Trades
31
Backtest insights
On 5 day candles, the crossover rule made 31 trades and won 38.71% of them. The profit factor of 1.10 means gross profits exceeded gross losses in this run, and it finished with a 22.60% total return. That gain came with a 58.02% maximum drawdown, so the path was volatile. It was also below the buy-and-hold final value of 12,585.61 USDT on 10,000.00 USDT starting capital over the test period, so holding ETH finished ahead in this test. Trading costs were not provided, so this run is a positive historical result, not proof of a lasting edge.

Performance may vary depending on market conditions. During trending periods, the strategy may behave differently compared to ranging markets, impacting both returns and drawdowns.
Strategy Explanation
What It Is
The Hull Moving Average (HMA) is a weighted moving average designed to respond faster to price changes than a simple average. This strategy uses a 10-period HMA calculated on the close. It enters long when the close crosses above the 10-period HMA and exits when the close crosses below it. There are no extra filters, stop losses, profit targets or short trades. The test started with 10,000.00 USDT and allocated 100.00% of current equity to each position, with at most one open position at a time, on a spot market.
How Signals Are Generated
Enter long when Close crosses above HMA(10); exit when Close crosses below HMA(10). The saved CoinQuant crosses-above and crosses-below rules define how an equal value at the crossover boundary is handled. There are no extra filters, shorts, discretionary entries or added stop/target conditions.
When It Works Best
Sustained directional movement can favor a moving-average crossover. This is a general strategy characteristic, not a confirmed explanation of this run's result.
When It Performs Poorly
Repeated crossings in sideways or rapidly reversing markets can create whipsaws and costs. The historical outcome must be read with that risk in mind.
Strengths

The Hull Moving Average (HMA) is a weighted moving average designed to respond faster to price changes than a simple average.
This strategy uses a 10-period HMA calculated on the close.
It enters long when the close crosses above the 10-period HMA and exits when the close crosses below it.
Limitations

Available market data made the test period shorter than planned. The test ran from 28 Oct 2023 to 23 Oct 2026, which is shorter than the period first planned. The price history and the indicator's start-up period have not been separately checked.
Trading fees were not provided for this run, which does not mean they were zero. Slippage and other trading costs were also not provided, so it is not known whether any costs were included in the simulated result.
With only 31 trades, the sample is small. The SQS score methodology is not described here. Results reflect one historical run with one parameter set.
Why Use CoinQuant Instead of Manual Trading or Other Platforms
Choosing the right way to test and execute trading strategies is critical. Below is a comparison between CoinQuant, manual trading, and other platforms to highlight key differences in speed, accuracy, and usability.
CoinQuant is designed specifically for traders who want to validate strategies quickly and reliably without coding. Unlike manual trading or traditional platforms, it allows you to test multiple scenarios, analyze performance instantly, and iterate faster using real data.
Frequently asked questions
Was the ETH HMA 10 crossover profitable on 5 day candles?
In this historical backtest, yes. It returned 22.60% over 31 trades with a profit factor of 1.10. It also had a 58.02% maximum drawdown and finished below the reported buy-and-hold final value.
What date range does this backtest cover?
The test ran from 28 Oct 2023 to 23 Oct 2026. Available market data made this period shorter than first planned.
Are trading fees and slippage included?
Unknown. Trading fees, slippage and other costs were not provided. Treat costs as unknown, not zero.
Does a positive backtest mean this strategy will make money?
No. This is one historical simulation with unknown costs and a small trade count. Past simulated results do not guarantee future returns.
Does this predict future returns?
No. Backtest performance is historical. Test assumptions, costs and data limitations matter, and future results may differ.