
Backtest Results
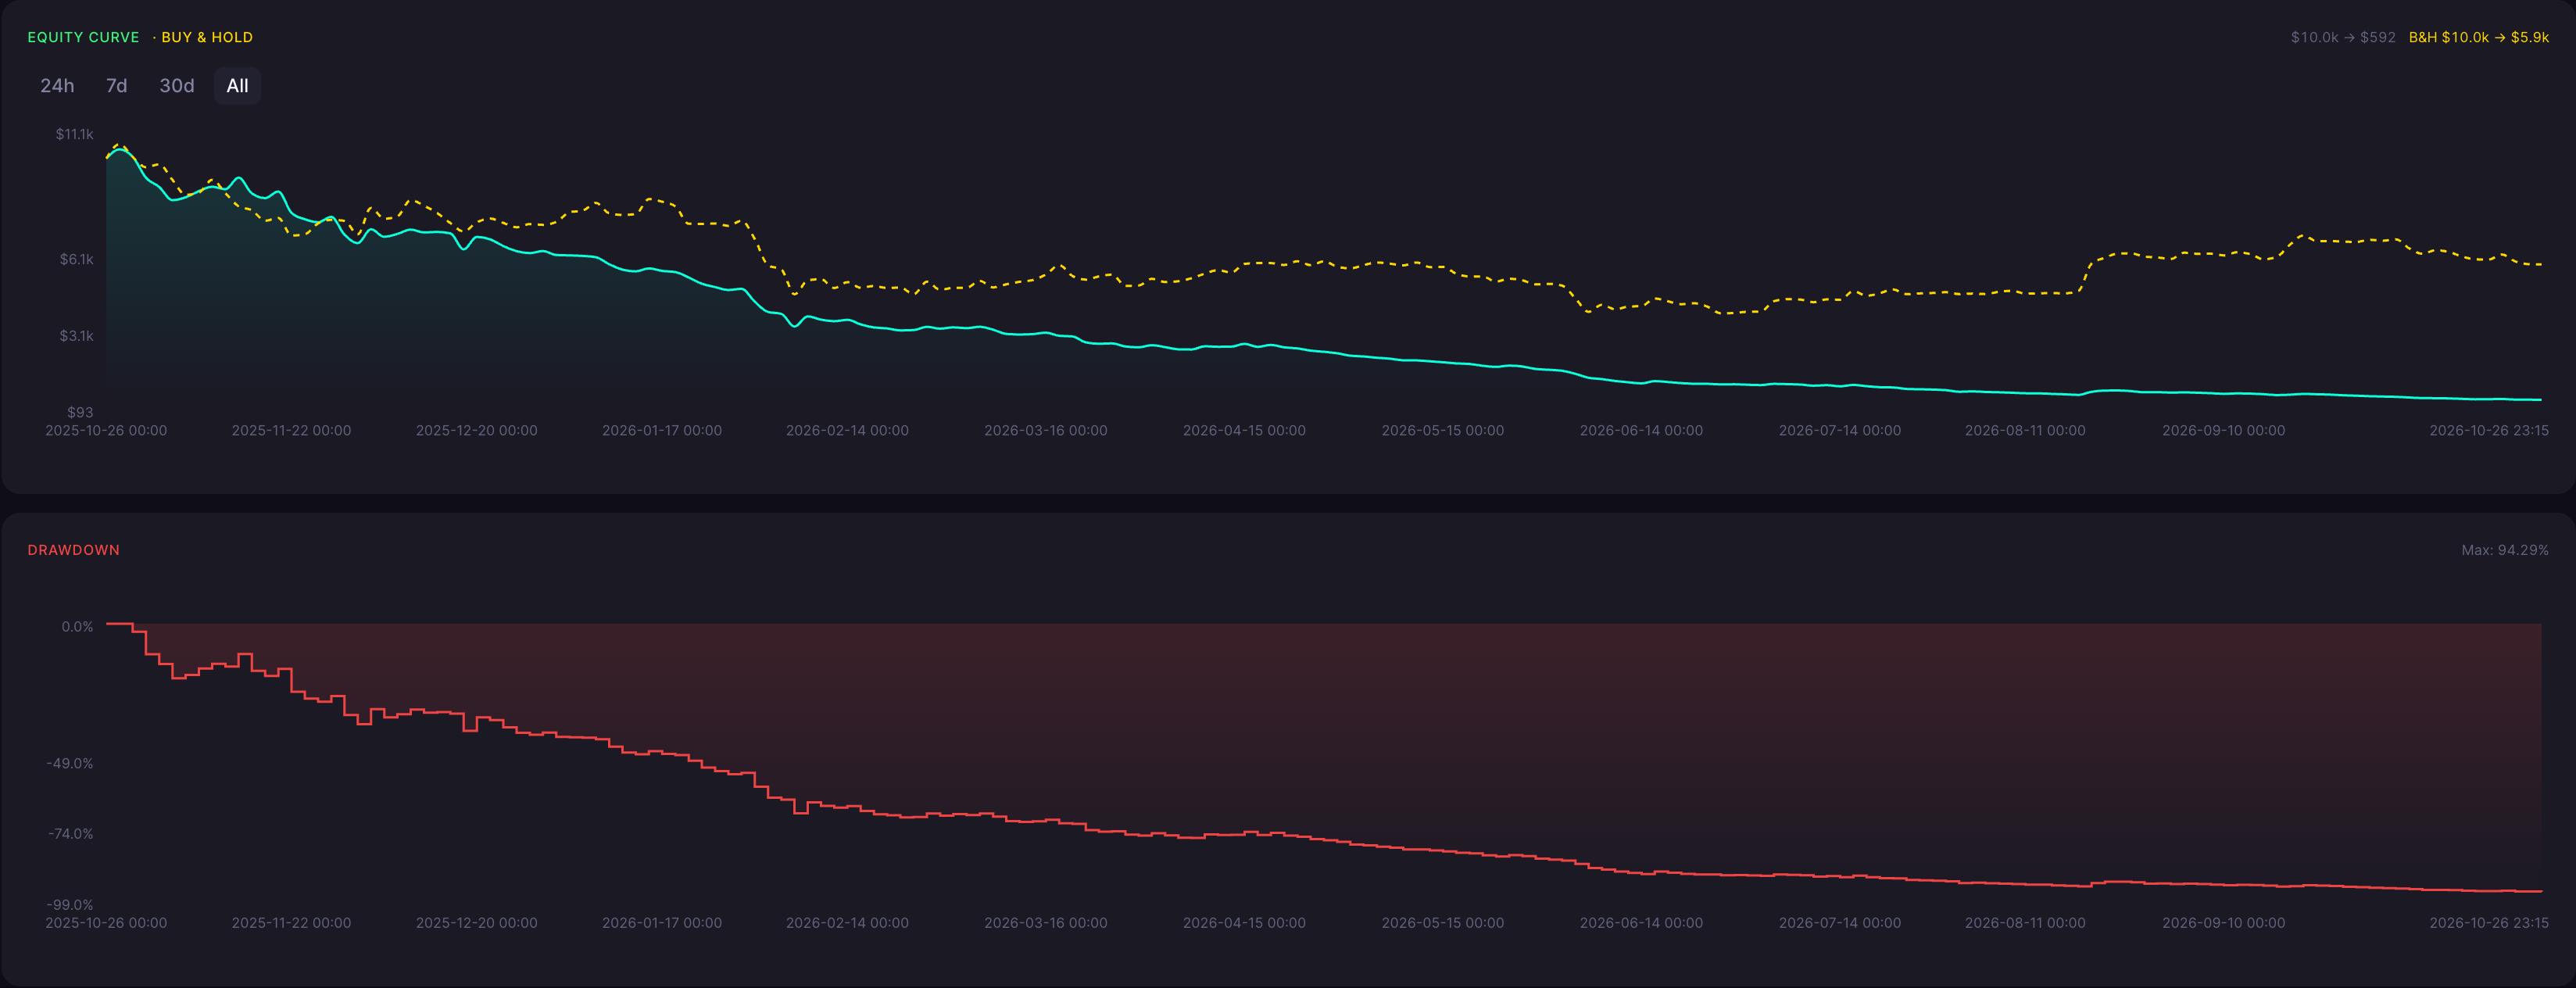
This backtest of the saved strategy "ETH 45m DEMA(10) Close Cross Long-Only" produced a negative result. Starting from 10,000 USDT, the account finished with a positive ending balance of 592.17 USDT, a total return of -94.08%. The maximum drawdown reached 94.29%. The test ran from 26 Oct 2025 to 26 Oct 2026. This does not confirm that the price data has no gaps. Trades took place from 26 Oct 2025 to 26 Oct 2026. These trade dates describe when trading occurred, not the boundaries of the tested data.
ROI
-94.08%
Win Rate
23.07%
Max DD
94.29%
Sharpe
-5.80
Profit Factor
0.59
Total Trades
1491
Backtest insights
In this single run, the long-only DEMA(10) crossover took 10,000 USDT down to a positive ending balance of 592.17 USDT, a -94.08% return, and recorded a 94.29% maximum drawdown. It completed 1,491 trades with a 23.07% win rate and a longest losing streak of 22 trades. The payoff ratio of 1.98 shows average wins exceeded average losses, yet the profit factor of 0.59 shows gross losses outweighed gross gains overall. Sharpe was -5.80. These figures describe what happened; this run did not measure why.

Performance may vary depending on market conditions. During trending periods, the strategy may behave differently compared to ranging markets, impacting both returns and drawdowns.
Strategy Explanation
What It Is
The Double Exponential Moving Average (DEMA) is a moving average designed to reduce the lag of a standard exponential moving average.
How Signals Are Generated
Entry: When the Close crosses above DoubleExponentialMovingAverage(period=10, source=close), the strategy enters long with a market order.
Exit: When the Close crosses below DoubleExponentialMovingAverage(period=10, source=close), the strategy exits the long position with a market order.
Only one entry can be open at a time, and each entry uses 100% of current equity.
When It Works Best
General theory, not a claim demonstrated by this run: close versus moving average crossovers tend to suit markets with sustained, directional trends, where price stays on one side of the average for extended stretches.
When It Performs Poorly
General theory, not a causal diagnosis of this run: crossover strategies tend to struggle in sideways or choppy markets, where price crosses back and forth over the average.
Strengths

Simple, transparent rules: Two crossover conditions fully define entries and exits, so every trade can be traced to a specific signal.
Easy to reproduce: The indicator, period, source, timeframe and sizing are explicit, so the same setup can be rebuilt and rerun.
Responsive indicator: DEMA is designed to reduce lag compared with a standard EMA, so signals respond quickly to price changes.
Limitations

Unknown costs: Trading fees and slippage were not provided, so real trading costs are unknown. Effective cost rates are unknown, not zero. The Total Fees figure is a total from the backtest, not the fee rates used, and live trading costs may differ.
Test dates: The test ran from 26 Oct 2025 to 26 Oct 2026. Whether the price data has gaps and how the indicators were prepared at the start of the test have not been independently checked. This does not confirm that the price data has no gaps. The test used 11812 price bars, which also does not prove the price history is continuous, and how the indicators were prepared at the start of the test is undocumented.
Limited generalization: This is one historical run on one asset, one timeframe and one parameter set. No optimization, robustness testing or out-of-sample evaluation was performed, so the result should not be generalized to other periods, assets or settings.
Why Use CoinQuant Instead of Manual Trading or Other Platforms
Choosing the right way to test and execute trading strategies is critical. Below is a comparison between CoinQuant, manual trading, and other platforms to highlight key differences in speed, accuracy, and usability.
CoinQuant is designed specifically for traders who want to validate strategies quickly and reliably without coding. Unlike manual trading or traditional platforms, it allows you to test multiple scenarios, analyze performance instantly, and iterate faster using real data.
Frequently asked questions
How does the DEMA strategy perform on ETH in the 45 minute timeframe?
The performance of the DEMA strategy on ETH in the 45 minute timeframe depends on market conditions. Based on the backtest results above, it achieved a return of -94.08% with a maximum drawdown of 94.29%. Results may vary depending on volatility and overall market trends.
Is the DEMA strategy reliable for trading ETH?
The DEMA strategy can be effective when used in the right conditions. For ETH, it typically performs well in sustained directional trends (general theory, not measured in this run) but may underperform during choppy or sideways markets (general theory, not measured in this run). Backtesting helps evaluate its reliability before applying it in live trading.
Why is backtesting important for trading strategies?
Backtesting allows traders to evaluate how a strategy would have performed using historical data. It helps identify strengths, weaknesses, and risk levels before applying the strategy in real markets, reducing the likelihood of unexpected losses.
How can I test the DEMA strategy on CoinQuant?
You can use CoinQuant to build and backtest the DEMA strategy without coding. Simply select your asset, define your strategy rules, and run a backtest to view detailed performance metrics instantly.
What are the best settings for the DEMA strategy on 45 minute?
The best settings for the DEMA strategy depend on the asset and timeframe. Traders often adjust parameters based on volatility and trading style. Using a backtesting platform like CoinQuant allows you to test different configurations and identify what works best.