
Backtest Results
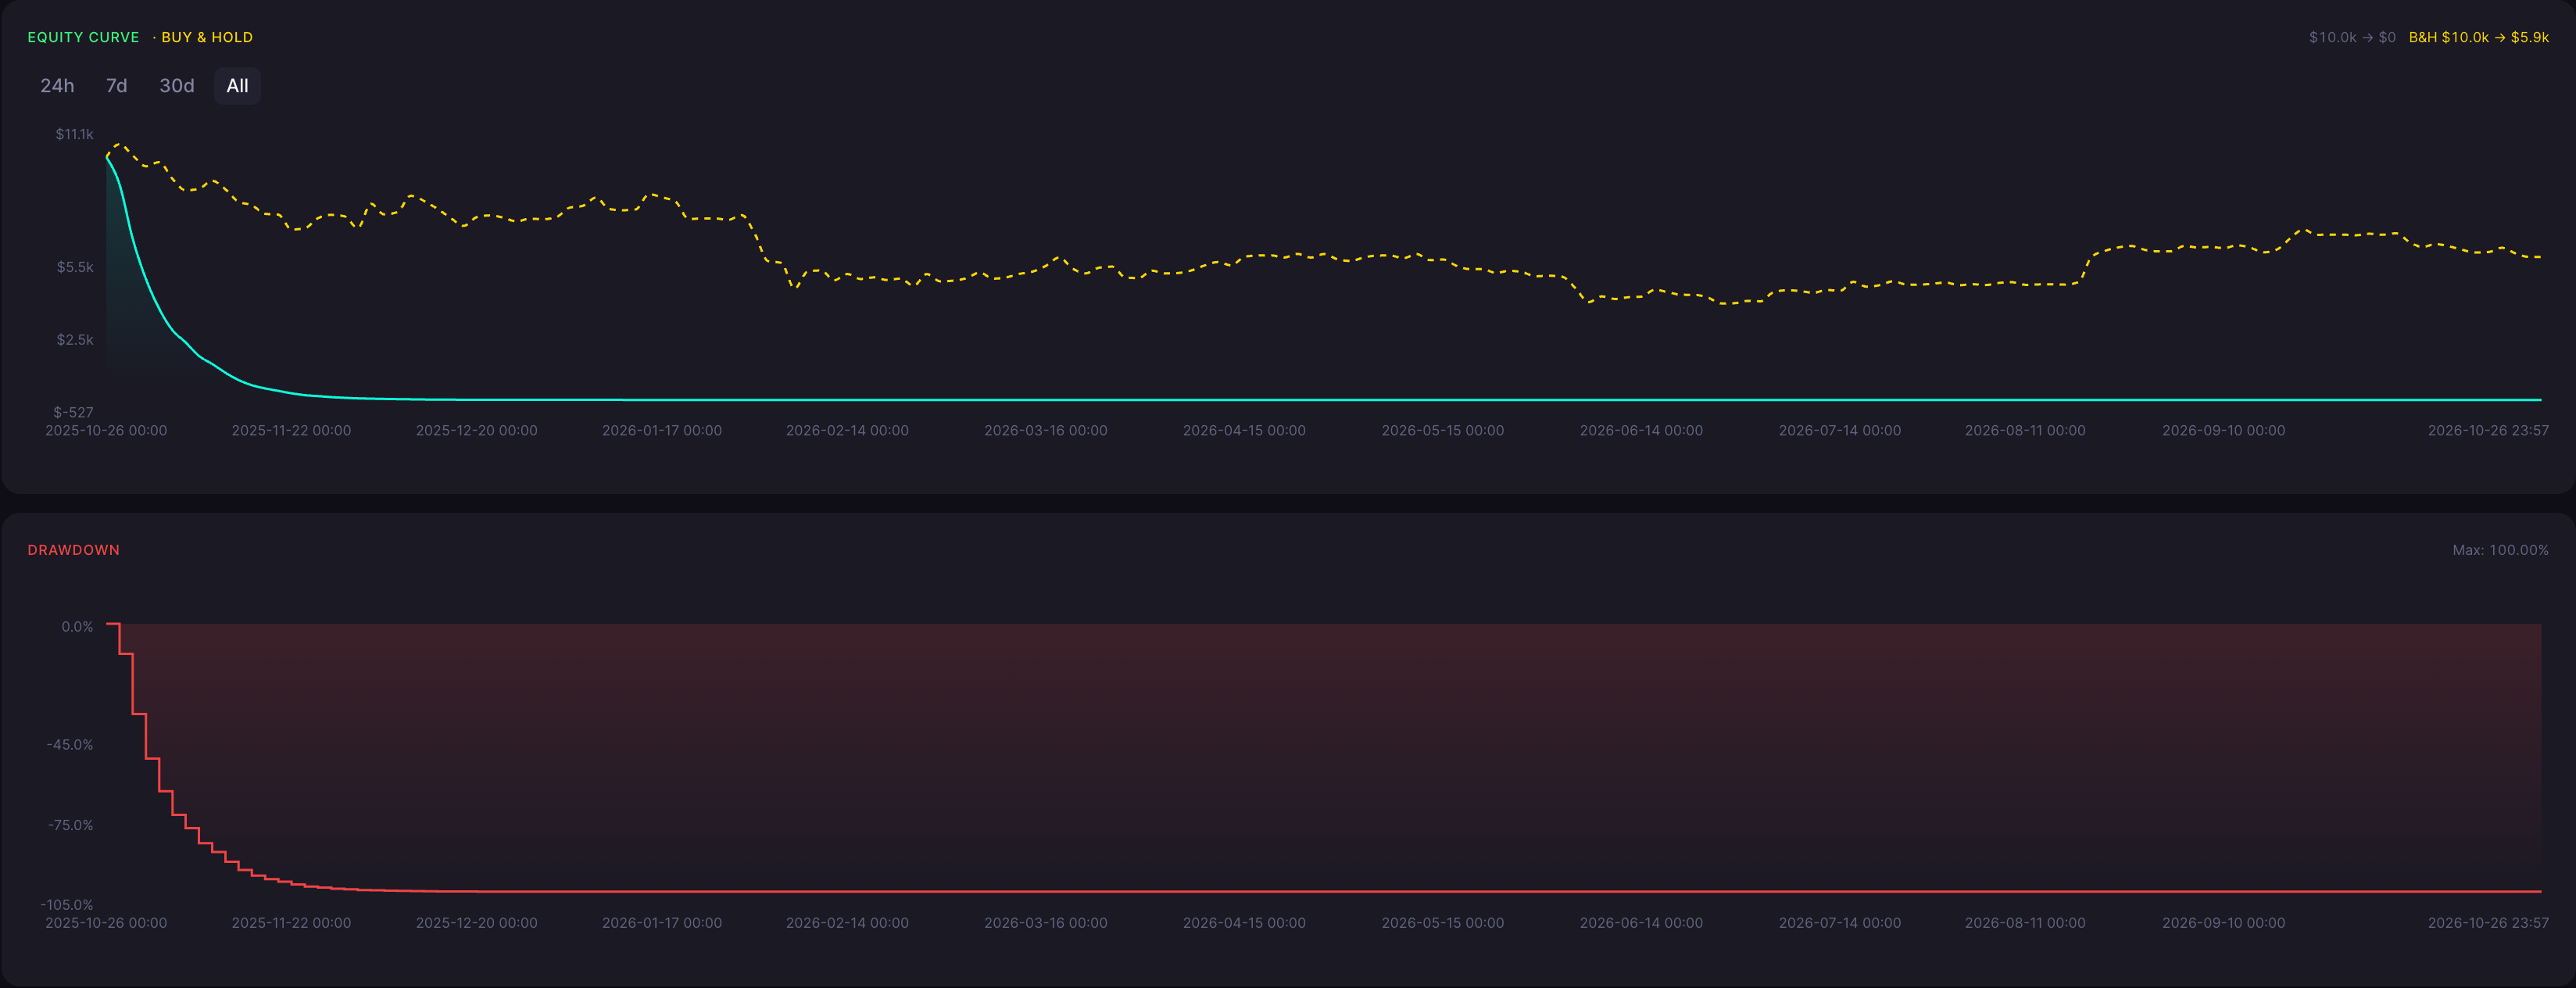
This ETH DEMA strategy 3 minute backtest tests a simple long-only crossover on ETHUSDT spot using 3 minute candles on CoinQuant. The rules are deliberately minimal: buy when the Close crosses above a 10-period Double Exponential Moving Average (DEMA), and exit when the Close crosses back below it. No filters, stops, targets or short trades were added. The result was not profitable. The strategy produced a near-total capital loss. The Total Return rounds to -100.00%, but a small amount of equity remained, so the account did not reach exactly zero. Maximum drawdown also rounds to 100.00%. The test ran from 26 Oct 2025 to 26 Oct 2026. These results do not confirm that the price history used was complete. Trades were recorded only between 26 Oct 2025 and 26 Jun 2026, and that last trade date is not the end of the test period. We document losing results like this one because they are as useful as winners. Knowing which simple rules fail on a given market and timeframe helps you avoid them, or gives you a baseline to improve on. CoinQuant lets you run the same kind of test on stocks, forex, gold, oil, crypto and more.
ROI
-100.00%
Win Rate
13.42%
Max DD
100.00%
Sharpe
-16.22
Profit Factor
0.18
Total Trades
10353
Backtest insights
The headline is simple: a 10-period DEMA crossover traded on raw 3 minute ETHUSDT candles, with full equity committed to every entry, lost almost all of its starting capital in this test. These figures describe what happened. They do not, on their own, explain why. Pinpointing the cause would require trade-level analysis that goes beyond these aggregates, so this page does not attribute the loss to any single factor.

Performance may vary depending on market conditions. During trending periods, the strategy may behave differently compared to ranging markets, impacting both returns and drawdowns.
Strategy Explanation
What It Is
The Double Exponential Moving Average (DEMA) is a trend-following moving average designed to react faster than a standard Exponential Moving Average (EMA). It is commonly calculated as two times an EMA minus an EMA of that EMA. The goal is to reduce the lag that ordinary moving averages carry, so the line hugs price more closely.
In this backtest, CoinQuant's DoubleExponentialMovingAverage indicator was used with a period of 10 and the Close price as its source.
How Signals Are Generated
The rules are a plain price and DEMA crossover:
Entry (long): the Close crosses above DEMA(10).
Exit (long): the Close crosses below DEMA(10).
Direction: long only. No short trades.
Position sizing: 100% of current equity per entry, with a maximum of one open entry.
Extras: none. No filters, confirmations, stop losses or profit targets were requested.
A short, fast indicator on 3 minute candles can be crossed frequently in general. This run recorded 10,353 trades, but the aggregate results do not establish why the trade count was high.
When It Works Best
As general background on moving average crossovers, not a conclusion drawn from this run, DEMA crossover systems tend to suit markets with sustained, directional moves, where a fast average lets a trader enter early and stay in while the trend persists. Longer timeframes or additional trend filters are often used to help the signal focus on more meaningful moves.
When It Performs Poorly
Also as general background, crossover strategies of this type commonly struggle in choppy, range-bound or noisy conditions, where price repeatedly crosses the average without follow-through. Very short timeframes and short lookback periods can increase how often that happens. This is a general characteristic of the approach, not a diagnosis of why this specific backtest lost money.
Strengths

Simple, transparent rules that are easy to reproduce and audit.
Fast-reacting indicator with less lag than a standard EMA.
A useful baseline for testing whether added filters, stops or different timeframes change the outcome.
Limitations

In this backtest, the strategy produced a near-total capital loss (rounded -100.00% return). Win rate of 13.42% and profit factor of 0.18 in this run. No stops, targets or filters were requested.
Trading costs are unknown because fees and slippage were not provided.
Test dates: 26 Oct 2025 to 26 Oct 2026. The test ran from 26 Oct 2025 to 26 Oct 2026, but this does not confirm that the price history used was complete. Bars consumed (175,780) and performance observations (367) do not prove raw data continuity. How the strategy's indicator starts up at the beginning of the test is not documented. Recorded trades end at 26 Jun 2026, well before the end of the test period, and the reason is not known. Past backtest results do not guarantee future returns.
Why Use CoinQuant Instead of Manual Trading or Other Platforms
Choosing the right way to test and execute trading strategies is critical. Below is a comparison between CoinQuant, manual trading, and other platforms to highlight key differences in speed, accuracy, and usability.
CoinQuant is designed specifically for traders who want to validate strategies quickly and reliably without coding. Unlike manual trading or traditional platforms, it allows you to test multiple scenarios, analyze performance instantly, and iterate faster using real data.
Frequently asked questions
Was the ETH DEMA 3 minute strategy profitable in this backtest?
No. It produced a near-total capital loss. Total Return rounds to -100.00%.
Did the account go to exactly zero?
No. The displayed -100.00% return and $0 chart label are rounded. The rounded return of -100.00% is a near-total loss rather than exact zero equity, since a small amount remained.
How many trades did the strategy take?
10353 trades, recorded between 26 Oct 2025 and 26 Jun 2026.
Why did trades stop in June 2026 if the data runs to October 2026?
The available data does not establish a cause. The test period ran to 26 Oct 2026, and the last recorded trade was at 26 Jun 2026. We do not speculate on the reason.
Were trading fees and slippage included?
Effective costs are unknown. Trading fees and slippage were not provided for this run. That means they are unknown, not zero.