
Live Backtest Results
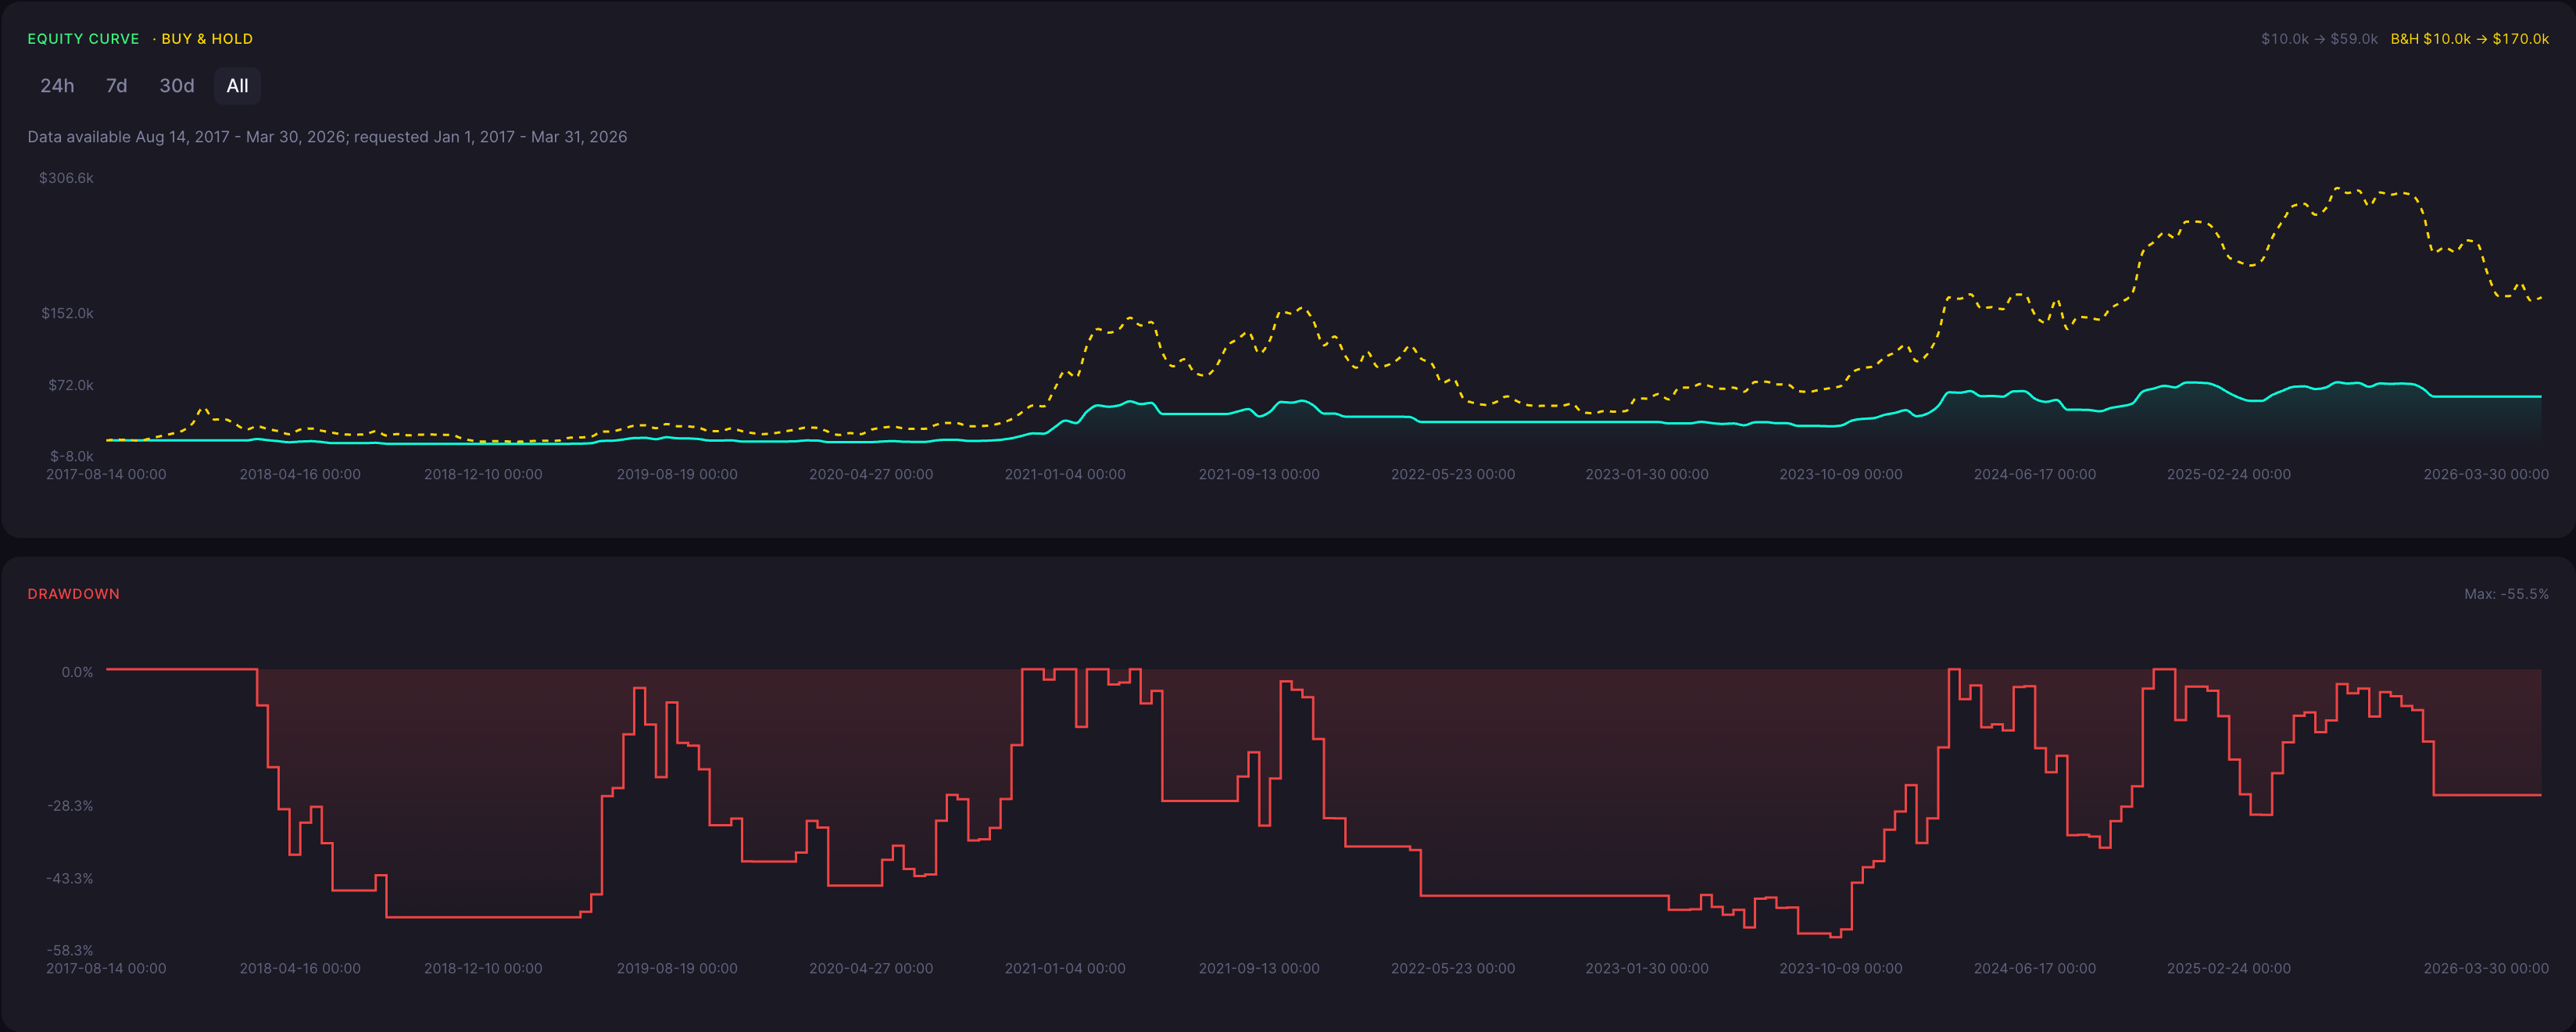
This BTC/USDT Weekly backtest evaluates a long-only Variable Index Dynamic Average strategy using VIDYA(14), with the real CoinQuant performance metrics and chart below.
ROI
489.99%
Win Rate
30.0%
Max DD
55.49%
Sharpe
0.66
Profit Factor
2.46
Total Trades
20
Backtest insights
For this VIDYA test on BTC/USDT Weekly, Total Return: 489.99% \| Sharpe Ratio: 0.66 \| Profit Factor: 2.46 \| Maximum Drawdown: 55.49% \| Win Rate: 30.0% \| Total Trades: 20. Historical results describe this specific configuration and do not guarantee future results.

Performance may vary depending on market conditions. During trending periods, the strategy may behave differently compared to ranging markets, impacting both returns and drawdowns.
Strategy Explanation
What the Strategy Measures
VIDYA is an adaptive moving average that changes its responsiveness with market momentum. This test uses VIDYA(14) on the Weekly timeframe.
Entry and Exit Rules
The strategy enters when close crosses above a rising VIDYA(14) and exits when close crosses below VIDYA(14).
When It Can Work Well
The rule can be most useful in sustained trends, where an adaptive average can remain aligned with direction while filtering some noise.
Strengths

VIDYA(14) adjusts its responsiveness as momentum changes, rather than using a fixed-response moving average.
The close and rising-VIDYA crossover turns the indicator into explicit long entry and exit conditions.
The long-only configuration makes return, drawdown, win rate, and trade count available for historical review.
Limitations

Sideways price action can create repeated crossings around the VIDYA line and lead to whipsaws.
A rising-VIDYA requirement can confirm a move after it has started, so a reversal can reduce the trend captured.
This historical BTC/USDT configuration does not guarantee future results under different market conditions.
Why Use CoinQuant Instead of Manual Trading or Other Platforms
Choosing the right way to test and execute trading strategies is critical. Below is a comparison between CoinQuant, manual trading, and other platforms to highlight key differences in speed, accuracy, and usability.
CoinQuant is designed specifically for traders who want to validate strategies quickly and reliably without coding. Unlike manual trading or traditional platforms, it allows you to test multiple scenarios, analyze performance instantly, and iterate faster using real data.
Frequently asked questions
How did the BTC VIDYA strategy perform on Weekly?
Total Return: 489.99% \| Sharpe Ratio: 0.66 \| Profit Factor: 2.46 \| Maximum Drawdown: 55.49% \| Win Rate: 30.0% \| Total Trades: 20.
What rules were tested?
Enter long when the close price crosses above a rising VIDYA(14) line. Exit long when the close price crosses below the VIDYA(14) line.
Why use a backtest?
Backtesting tests a defined rule on historical data before risking capital and makes return, drawdown, trade count, and other performance measures visible.
Does VIDYA(14) guarantee a profitable trade?
No. The tested crossover is a historical rule, and individual trades can lose money when price reverses or the market is choppy.
Why should VIDYA results be read with drawdown and trade count?
Return alone does not describe the path of a backtest. Maximum drawdown shows the largest historical decline, while trade count gives context for how often the rule acted.