
Live Backtest Results
This backtest analyzes the performance of the Vertical Horizontal Filter trend strategy on BTC/USDT over the 5 day timeframe using historical market data. The Vertical Horizontal Filter is a 28-period trendiness indicator that compares the range between the highest and lowest closing prices to the sum of the absolute bar-to-bar price changes over the same window. This strategy treats a Vertical Horizontal Filter reading above 0.35, combined with the close price above the 20-period simple moving average, as confirmation of a trending market and exits once the filter drops below 0.35 or price falls below the moving average. The results provide insight into profitability, risk exposure, and consistency.
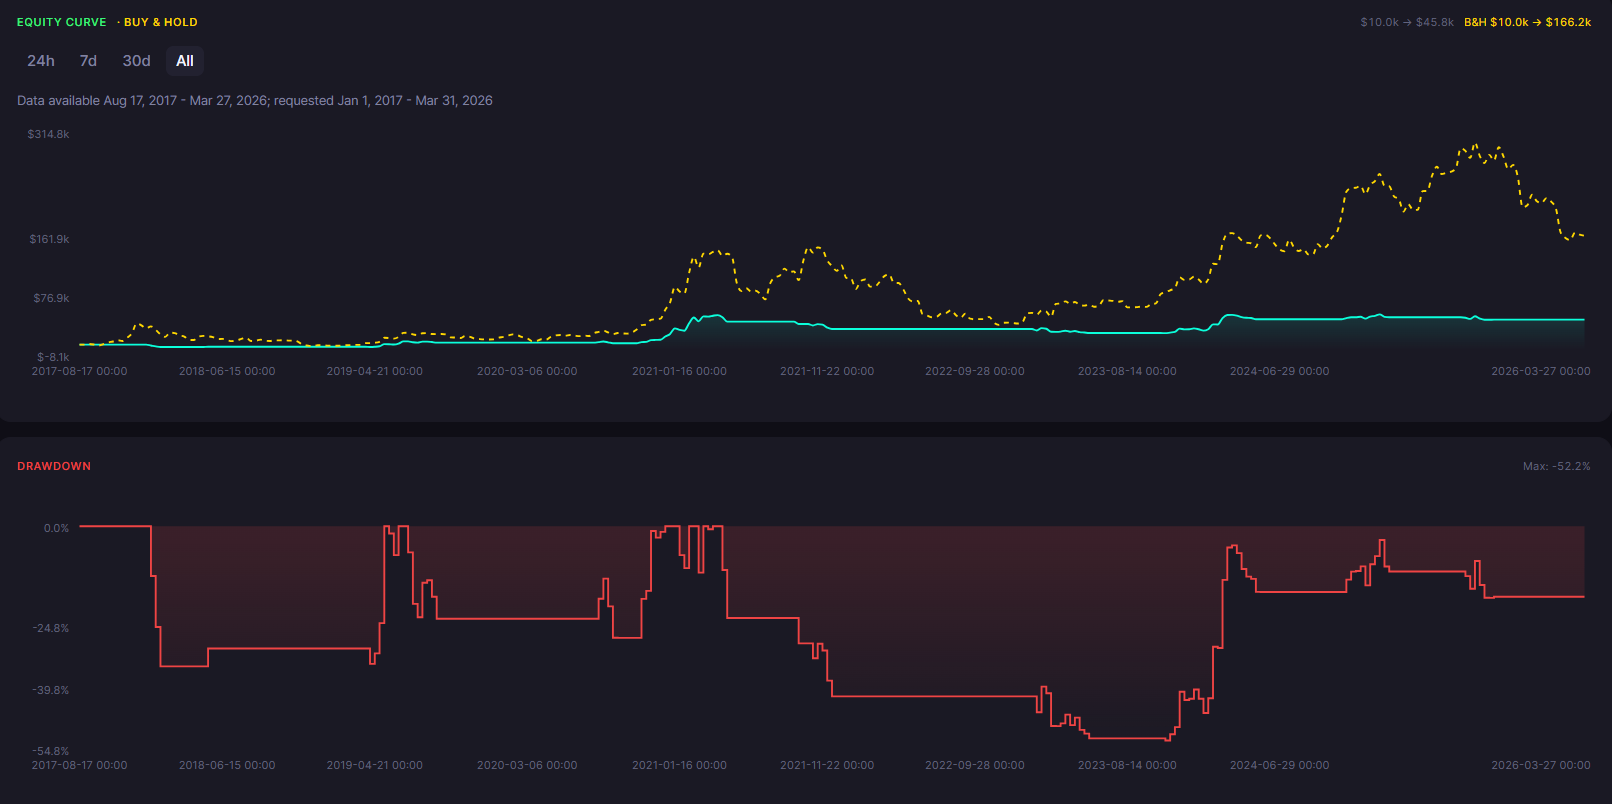
ROI
358.4%
Win Rate
46.2%
Max DD
52.19%
Sharpe
0.68
Profit Factor
2.49
Total Trades
13
Backtest insights
The Vertical Horizontal Filter trend strategy generated a total return of 358.4% over the 5 day timeframe. With a maximum drawdown of 52.19% and a win rate of 46.2% across 13 trades, entering when the filter rises above 0.35 with price above the 20-period simple moving average, and exiting when the filter fades below 0.35 or price loses the moving average, aims to capture the meat of a genuine trend while stepping aside once conditions turn choppy.

Performance may vary depending on market conditions. During trending periods, the strategy may behave differently compared to ranging markets, impacting both returns and drawdowns.
How the BTC Vertical Horizontal Filter Strategy Works
What It Is
The Vertical Horizontal Filter measures whether a market is trending or ranging. It compares the range between the highest and lowest closing prices over a 28-period lookback window to the sum of the absolute bar-to-bar price changes over that same window. High readings mean the market is trending strongly, low readings mean the market is choppy and directionless. This BTC Vertical Horizontal Filter strategy is a trend-confirmation system: it goes long only when the filter rises above the level 0.35 on the 5 day timeframe and the close price is above the 20-period simple moving average, treating that combination as confirmation of a genuine trend, and exits when the filter drops below 0.35 or price falls below the moving average.
How Signals Are Generated
A long entry triggers when the Vertical Horizontal Filter rises above the level 0.35 on the 5 day timeframe while the close price is above the 20-period simple moving average, confirming that the market has entered a trending regime with price moving in the expected direction. The position exits when the Vertical Horizontal Filter drops back below 0.35, signaling the trend has faded into a choppy range, or when the close price falls below the 20-period simple moving average, signaling the trend has reversed.
When It Works Best
The setup works well in directional, trending markets, since a Vertical Horizontal Filter reading above 0.35 confirms genuine trendiness rather than random noise, and the SMA filter helps confirm the trade is aligned with the prevailing direction. The 5 day timeframe captures a specific market rhythm where these trending and consolidation phases tend to play out clearly enough for the entry and exit rules to line up.
When It Performs Poorly
Choppy, low-conviction conditions are the main weak spot: repeated brief pushes of the Vertical Horizontal Filter above 0.35 each trigger an entry, and the exit rule, a drop back below 0.35 or a close under the 20-period simple moving average, does not always cut losses quickly enough when whipsaws are frequent.
Strengths

Filters out choppy, low-trendiness conditions before taking a position
The moving average filter keeps the strategy aligned with the direction of the move
Rule-based entry and exit reduce emotional decision-making
Limitations

Prone to whipsaws in range-bound markets, the filter can flip above and below 0.35 repeatedly without a real trend forming
Choppy, sideways price action inside a narrow trading range can trigger repeated entries and exits with no net progress
Fixed 28-period lookback and 0.35 threshold may not be optimal for every regime
Why Use CoinQuant Instead of Manual Trading or Other Platforms
Choosing the right way to test and execute trading strategies is critical. Below is a comparison between CoinQuant, manual trading, and other platforms to highlight key differences in speed, accuracy, and usability.
CoinQuant is designed specifically for traders who want to validate strategies quickly and reliably without coding. Unlike manual trading or traditional platforms, it allows you to test multiple scenarios, analyze performance instantly, and iterate faster using real data.
Frequently asked questions
How does the Vertical Horizontal Filter strategy perform on BTC/USDT in the 5 day timeframe?
In this backtest the Vertical Horizontal Filter trend strategy on the 5 day timeframe generated a return of 358.4% with a maximum drawdown of 52.19% and a win rate of 46.2% across 13 trades. These results are based on historical backtest data and actual performance may vary.
What is the Vertical Horizontal Filter indicator?
The Vertical Horizontal Filter is a trendiness indicator that compares the range between the highest and lowest closing prices over a 28-period window to the sum of the absolute bar-to-bar price changes over that window. High readings signal a trending market, low readings signal a choppy, ranging market. Here, a reading above 0.35 combined with price above the 20-period simple moving average triggers entry, and a drop below 0.35 or price losing the moving average triggers exit.
Why is backtesting important for trading strategies?
Backtesting evaluates how a strategy would have performed on historical data before risking real capital. It reveals metrics like ROI, drawdown, and win rate that show whether a strategy has a genuine edge. Without backtesting, traders are flying blind.
How can I test the Vertical Horizontal Filter strategy on CoinQuant?
Describe the strategy in natural language, select BTC/USDT and the 5 day timeframe, and CoinQuant instantly generates a full backtest with all performance metrics, no coding required.
What are the best settings for the Vertical Horizontal Filter strategy on the 5 day timeframe?
Optimal settings depend on the lookback length used to calculate the filter and the threshold level chosen for entry and exit. The default used here is a 28-period Vertical Horizontal Filter with a 0.35 threshold and a 20-period simple moving average confirmation filter. A lower threshold triggers more often but catches weaker trends; a higher threshold waits for stronger confirmation but enters later. CoinQuant lets you test multiple threshold levels to find the best fit for the 5 day timeframe.
Explore similar strategies
