Live Backtest Results
This backtest analyzes the performance of the Mean Reversion strategy on BTC/USDT over the 2 Hour timeframe using historical market data. The results provide insight into how the strategy would have performed under real market conditions, including profitability, risk exposure, and consistency.
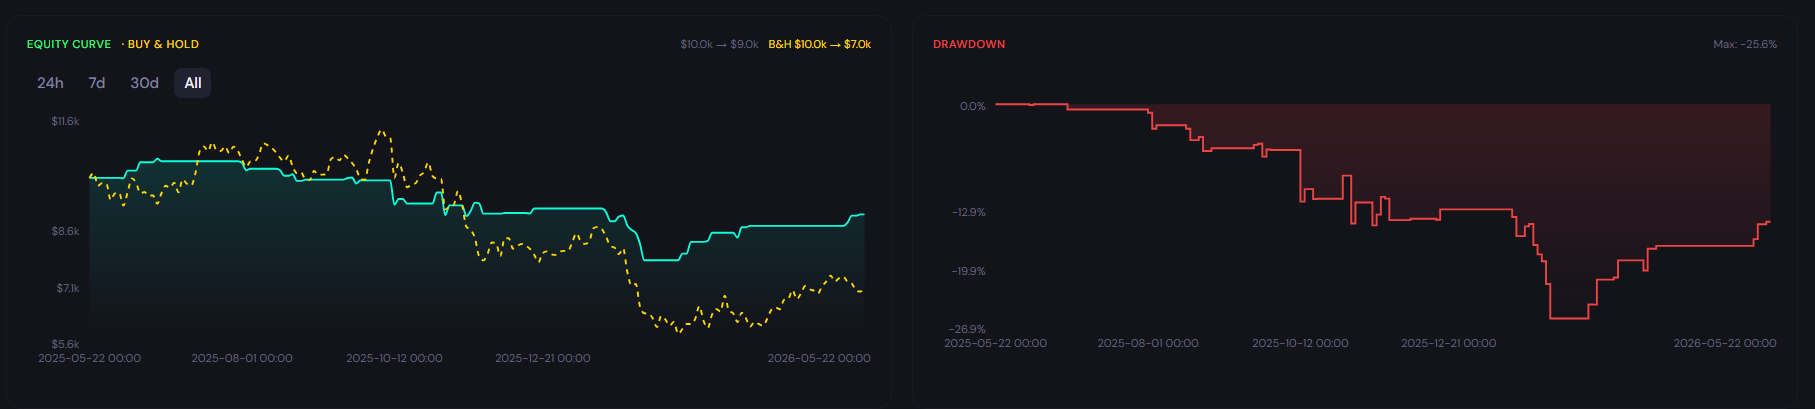
ROI
-9.67%
Win Rate
60.6%
Max DD
28.76%
Sharpe
-0.41
Profit Factor
0.74
Total Trades
33
Backtest insights
The strategy generated a total return of -9.67%, indicating slightly negative performance. The maximum drawdown of 28.76% suggests elevated risk that requires disciplined position sizing. With a win rate of 60.6% across 33 trades, the strategy demonstrates moderate consistency, with a mixed distribution of winning and losing trades.

Performance may vary depending on market conditions. During trending periods, the strategy may behave differently compared to ranging markets, impacting both returns and drawdowns.
How the Mean Reversion Strategy Works
What It Is
The Mean Reversion strategy is a contrarian approach that identifies oversold conditions on the 2 Hour timeframe. It enters long when BTC/USDT price becomes oversold -- specifically when RSI drops below 30 AND price is below the lower Bollinger Band (2 standard deviations from the mean). This dual condition filters for genuine mean reversion opportunities where price is statistically stretched. The strategy exits when RSI recovers above 50 or price crosses back above the middle Bollinger Band, capturing the reversion to the mean.
How Signals Are Generated
In this strategy, trading signals are generated based on predefined conditions. A buy signal occurs when RSI(14) drops below 30 (oversold) AND price closes below the lower Bollinger Band(20, 2), indicating price is statistically stretched below its mean. A sell signal occurs when RSI recovers above 50 (momentum normalization) OR price closes above the middle Bollinger Band, signaling the reversion is complete.
When It Works Best
This strategy tends to perform best in ranging markets with clear support and resistance levels, where mean reversion thrives when price oscillates within a defined range, repeatedly bouncing off the lower bound where RSI reaches oversold levels.
When It Performs Poorly
However, the strategy may underperform during strong trending markets where price continues to fall without reverting, as in sustained downtrends, oversold conditions can persist for extended periods, and the strategy may enter prematurely before the final bottom.
Strengths

Exploits the statistical tendency of price to revert to its mean after extreme moves
Dual entry condition (RSI + Bollinger Band) filters for high-probability oversold setups
Clear exit rules based on momentum normalization prevent premature profit-taking
Limitations
Underperforms in strong trending markets where oversold conditions persist and deepen
Requires patience during extended selloffs, the strategy may enter before the final bottom
Performance varies significantly by timeframe, optimal settings differ for each trading horizon
Why Use CoinQuant Instead of Manual Trading or Other Platforms
Choosing the right way to test and execute trading strategies is critical. Below is a comparison between CoinQuant, manual trading, and other platforms to highlight key differences in speed, accuracy, and usability.
CoinQuant is designed specifically for traders who want to validate strategies quickly and reliably without coding. Unlike manual trading or traditional platforms, it allows you to test multiple scenarios, analyze performance instantly, and iterate faster using real data.
Frequently asked questions
How does the Mean Reversion strategy perform on BTC/USDT in the 2 Hour timeframe?
The performance of the Mean Reversion strategy on BTC/USDT in the 2 Hour timeframe depends on market conditions. Based on the backtest results above, it achieved a return of -9.67% with a maximum drawdown of 28.76%. Results may vary depending on volatility and overall market trends.
Is the Mean Reversion strategy reliable for trading BTC/USDT?
The Mean Reversion strategy can be effective when used in the right conditions. For BTC/USDT, it typically performs well in ranging markets with clear support and resistance levels but may underperform during strong trending markets where price continues to fall without reverting. Backtesting helps evaluate its reliability before applying it in live trading.
Why is backtesting important for trading strategies?
Backtesting allows traders to evaluate how a strategy would have performed using historical data. It helps identify strengths, weaknesses, and risk levels before applying the strategy in real markets, reducing the likelihood of unexpected losses.
How can I test the Mean Reversion strategy on CoinQuant?
You can use CoinQuant to build and backtest the Mean Reversion strategy without coding. Simply select your asset, define your strategy rules, and run a backtest to view detailed performance metrics instantly.
What are the best settings for the Mean Reversion strategy on 2 Hour?
The best settings for the Mean Reversion strategy depend on the asset and timeframe. The configuration tested here uses RSI(14) with Bollinger Bands(20, 2). Using a backtesting platform like CoinQuant allows you to test different configurations and identify what works best.