
Live Backtest Results
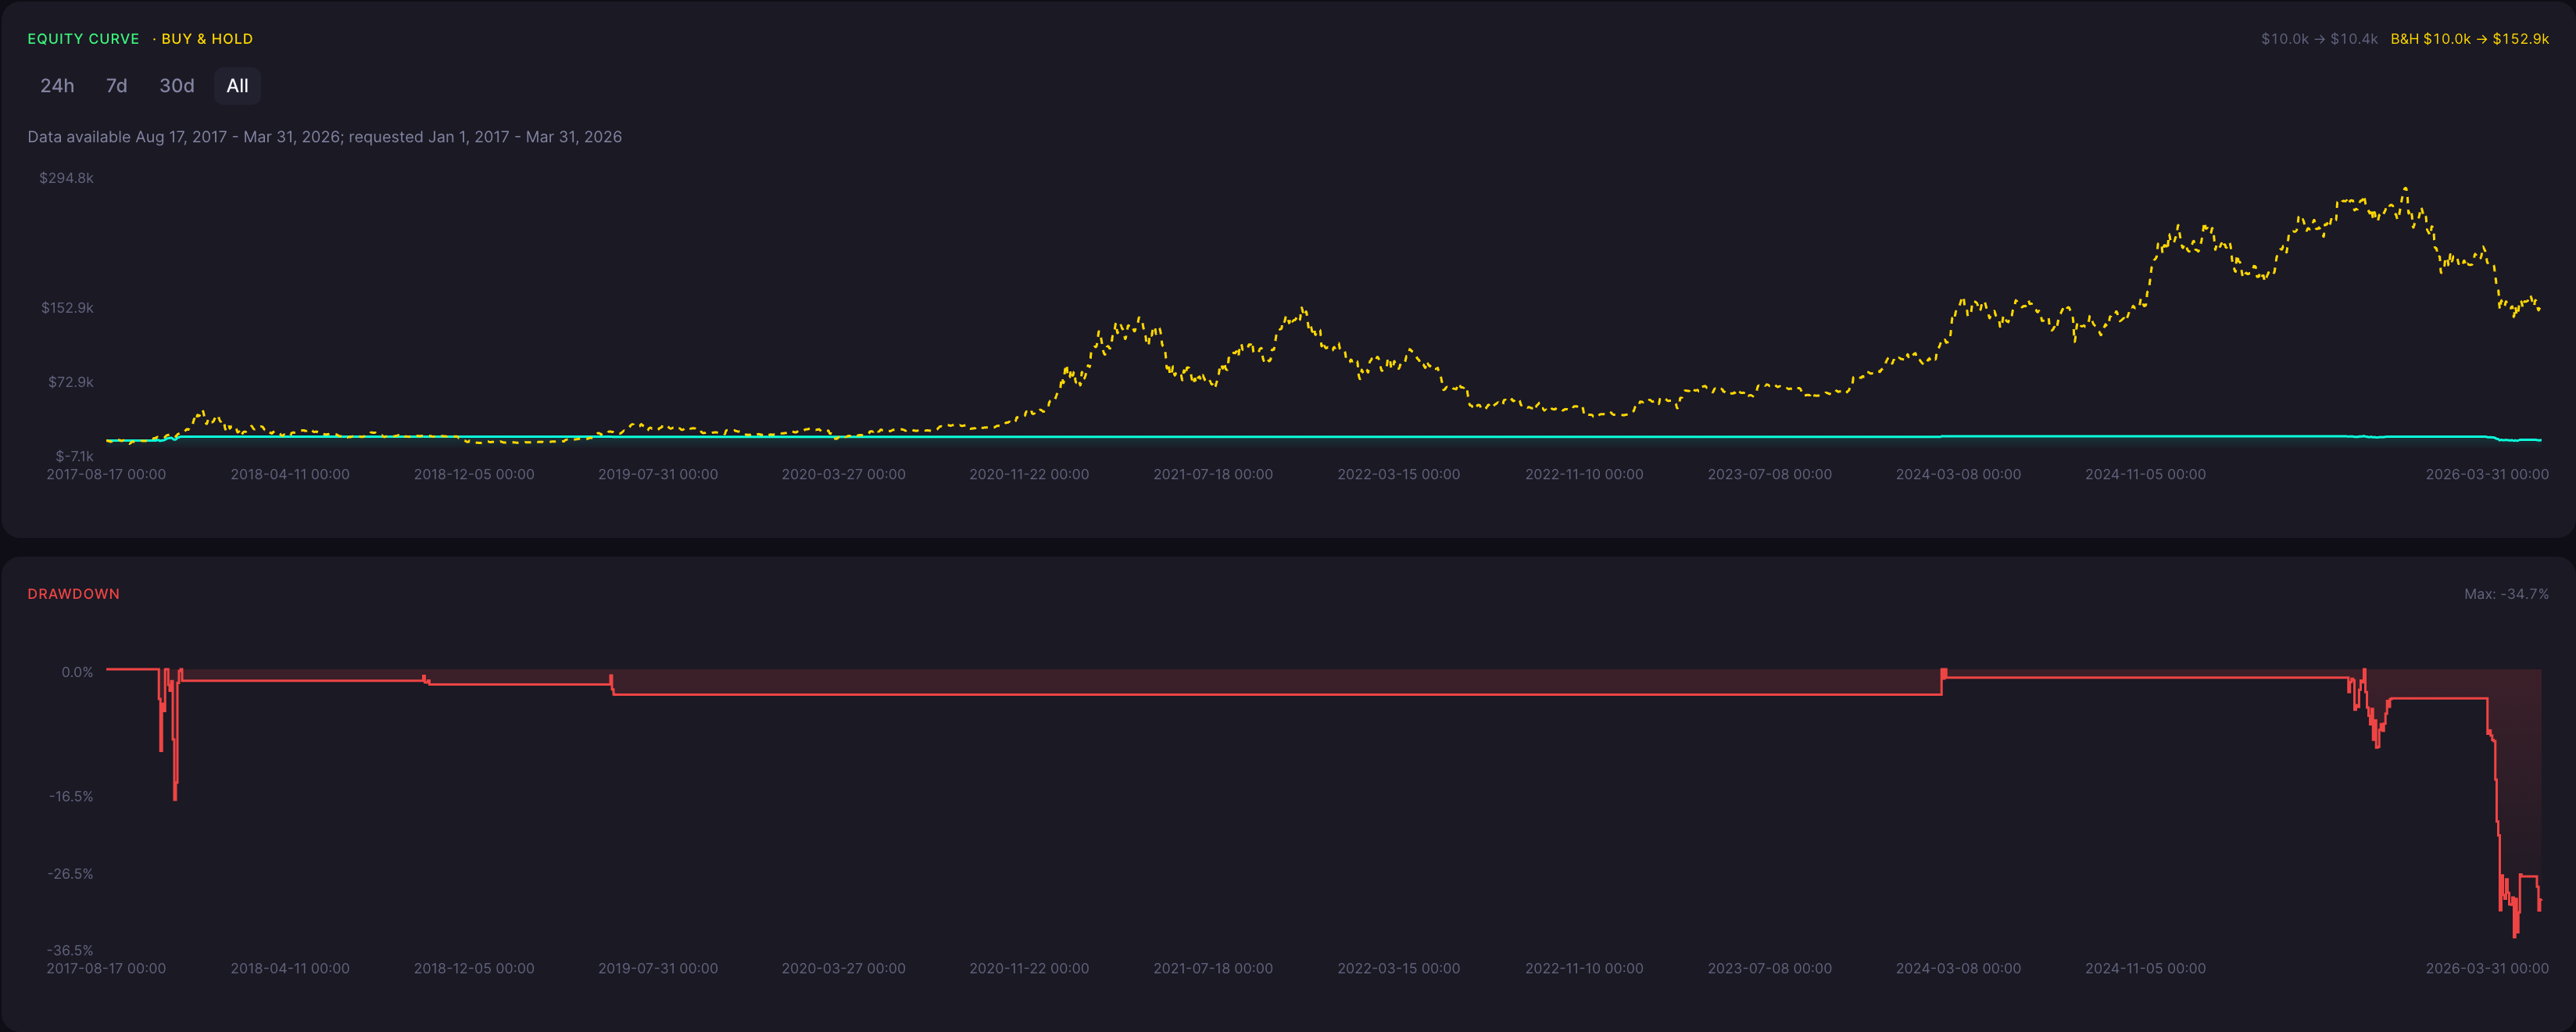
This backtest analyzes the BTC Hanging Man strategy over the 12 hour timeframe. The tested logic is consistent across the page: A long entry triggers when a Hanging Man pattern is detected on the selected timeframe. The position exits when a Bearish Engulfing pattern is detected, applying one consistent candle-pattern rule across the backtest.
ROI
4.3%
Win Rate
28.6%
Max DD
34.74%
Sharpe
0.10
Profit Factor
1.10
Total Trades
7
Backtest insights
The Hanging Man strategy generated a total return of 4.3% over the 12 hour timeframe. With a maximum drawdown of 34.74% and a win rate of 28.6% across 7 trades, the result shows how this candle-pattern rule reacted to BTC/USDT trend changes during the tested window. The same entry, exit, and timeframe rules are used across every metric on this page.

Performance may vary depending on market conditions. During trending periods, the strategy may behave differently compared to ranging markets, impacting both returns and drawdowns.
How the BTC Hanging Man Strategy Works
What It Is
The Hanging Man candle pattern has a small real body near the top of its range and a long lower shadow. It often appears after an advance and can show that sellers pushed price down before buyers recovered. This long-only test uses the Hanging Man pattern as the entry trigger and a Bearish Engulfing pattern as the exit reference. The page reports a real CoinQuant backtest on BTC/USDT 12 hour data.
How Signals Are Generated
A long entry triggers when a Hanging Man pattern is detected on the selected timeframe. The position exits when a Bearish Engulfing pattern is detected, applying one consistent candle-pattern rule across the backtest. This keeps the strategy auditable and repeatable inside CoinQuant.
When It Works Best
This strategy tends to work best when BTC/USDT absorbs the intrabar selling pressure and then continues higher after the pattern. The 12 hour timeframe captures a distinct market rhythm, so the same indicator can behave differently across horizons.
When It Performs Poorly
The strategy struggles when a Hanging Man precedes a sustained reversal or when the long lower shadow reflects growing seller control rather than temporary pressure.
Strengths

Tests a named cautionary candle pattern
Uses transparent candle-pattern entry and exit conditions
Measures one repeatable long-only rule across timeframes
Limitations

Traditional interpretation commonly treats the pattern as a warning after an advance
A long-only entry is a test design, not directional confirmation
Trend context can materially change signal meaning
Why Use CoinQuant Instead of Manual Trading or Other Platforms
Choosing the right way to test and execute trading strategies is critical. Below is a comparison between CoinQuant, manual trading, and other platforms to highlight key differences in speed, accuracy, and usability.
CoinQuant is designed specifically for traders who want to validate strategies quickly and reliably without coding. Unlike manual trading or traditional platforms, it allows you to test multiple scenarios, analyze performance instantly, and iterate faster using real data.
Frequently asked questions
How does the Hanging Man strategy perform on BTC/USDT in the 12 hour timeframe?
In this backtest the Hanging Man strategy on the 12 hour timeframe generated a return of 4.3% with a maximum drawdown of 34.74% and a win rate of 28.6% across 7 trades. These results are based on historical backtest data and actual performance may vary.
What is the Hanging Man indicator?
The Hanging Man candle pattern has a small real body near the top of its range and a long lower shadow. It often appears after an advance and can show that sellers pushed price down before buyers recovered. This long-only test uses the Hanging Man pattern as the entry trigger and a Bearish Engulfing pattern as the exit reference.
Why is backtesting important for trading strategies?
Backtesting evaluates how a strategy would have performed on historical data before risking real capital. It reveals metrics like ROI, drawdown, and win rate that show whether a strategy has a genuine edge.
How can I test the Hanging Man strategy on CoinQuant?
Paste the exact strategy prompt from this page into CoinQuant, select BTC/USDT and the 12 hour timeframe, and CoinQuant generates a full backtest with performance metrics, no coding required.
What are the best settings for the Hanging Man strategy on the 12 hour timeframe?
Optimal settings depend on the indicator parameters, timeframe, market regime, and trading objective. The default tested here is the exact rule shown in the strategy prompt. CoinQuant lets you test parameter variations to find the best fit for the 12 hour timeframe.
Explore similar strategies
