
Backtest Results
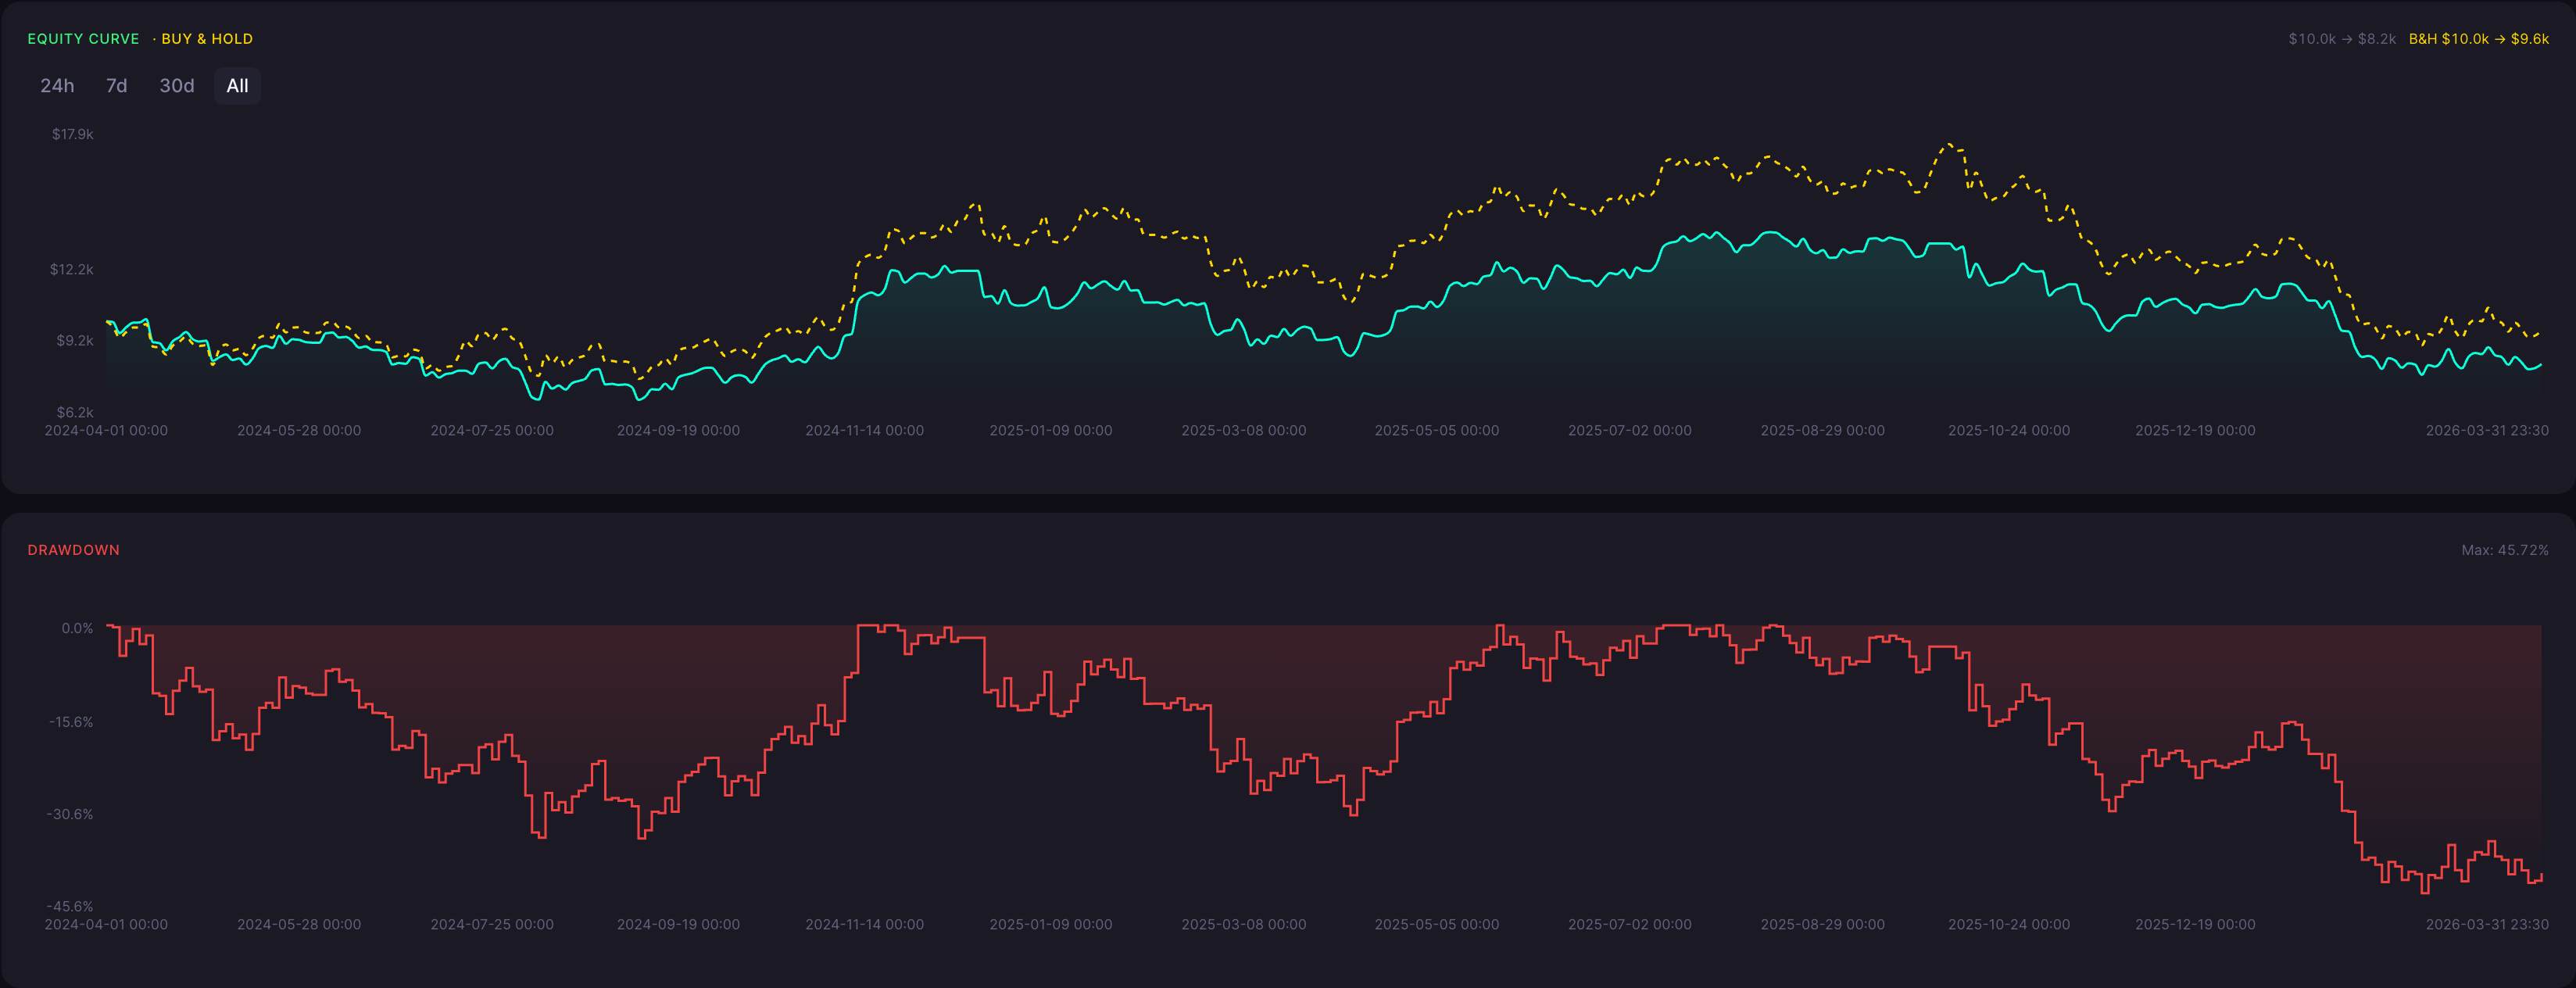
At the 30 minute resolution, the BTC Dark Cloud Cover experiment reported -17.87% ROI and 45.72% maximum drawdown over 2024-04-01 to 2026-03-31. These are measured historical outcomes, not forecasts. The rule pairing was unchanged throughout this page: Enter long when a Bullish Engulfing pattern is detected. Exit long when a Dark Cloud Cover pattern is detected.
ROI
-17.87%
Win Rate
36.11%
Max DD
45.72%
Sharpe
0.01
Profit Factor
0.87
Total Trades
36
Backtest insights
This 30 minute test recorded 36 closed trades, -17.87% ROI, 36.11% win rate and 45.72% maximum drawdown. Sharpe Ratio is 0.01 and Profit Factor is 0.87. Aggregate figures do not identify which market regimes drove performance. The result is historical evidence for this rule, not a validated profitable recipe.

Performance may vary depending on market conditions. During trending periods, the strategy may behave differently compared to ranging markets, impacting both returns and drawdowns.
How the BTC Dark Cloud Cover Strategy Works
What It Is
Dark Cloud Cover is a bearish two-candle reversal pattern in which the second bearish candle closes into the preceding bullish real body. Here it is an exit-long signal following Bullish Engulfing. No short entry, volume threshold or separate confirmation candle is modeled.
How Signals Are Generated
Enter long when a Bullish Engulfing pattern is detected. Exit long when a Dark Cloud Cover pattern is detected. The named Dark Cloud Cover detector supplies the exit signal on this timeframe. Only enter_long and exit_long are permitted. No stops, targets, trend, volume or extra confirmation filters were requested.
When It Works Best
The Dark Cloud Cover exit hypothesis may be useful when the observed reversal warning has follow-through. For entry-focused tests, recovery must persist after entry; for exit-focused tests, seller pressure must develop after the long entry. This is an explanatory hypothesis, not a regime claim proven by aggregate results.
When It Performs Poorly
A Dark Cloud Cover signal can fail in noisy ranges or before the prior trend resumes. Detector-only long entries can remain exposed during falling markets; long exits may be premature or late. The 30 minute sampling horizon does not remove these risks.
Strengths

Preserves the exact Dark Cloud Cover detector role
Uses auditable long entry and exit rules
Reports real backtest metrics and backtest result identifiers that cannot be changed and come from the actual CoinQuant run
Limitations

Pattern recognition does not guarantee returns
No separate confirmation, trend or volume conditions
Trading costs can be unspecified, which does not mean they are zero
Why Use CoinQuant Instead of Manual Trading or Other Platforms
Choosing the right way to test and execute trading strategies is critical. Below is a comparison between CoinQuant, manual trading, and other platforms to highlight key differences in speed, accuracy, and usability.
CoinQuant is designed specifically for traders who want to validate strategies quickly and reliably without coding. Unlike manual trading or traditional platforms, it allows you to test multiple scenarios, analyze performance instantly, and iterate faster using real data.
Frequently asked questions
How did BTC Dark Cloud Cover perform on 30 Minute?
The historical result was -17.87% ROI, 45.72% maximum drawdown, 36.11% win rate and 36 closed trades. Past outcomes do not guarantee future results.
What does Dark Cloud Cover represent?
Dark Cloud Cover is a bearish two-candle reversal pattern in which the second bearish candle closes into the preceding bullish real body. Here it is an exit-long signal following Bullish Engulfing. No short entry, volume threshold or separate confirmation candle is modeled.
Is this a short strategy?
No. It is long-only. The named pattern is an exit signal. Enter long when a Bullish Engulfing pattern is detected. Exit long when a Dark Cloud Cover pattern is detected.
Does this test include confirmation?
No separate confirmation, trend or volume filters are modeled.
How can I reproduce the 30 Minute result?
Use the exact prompt below and inspect the saved settings. A new execution can differ and can consume credits.