
Live Backtest Results
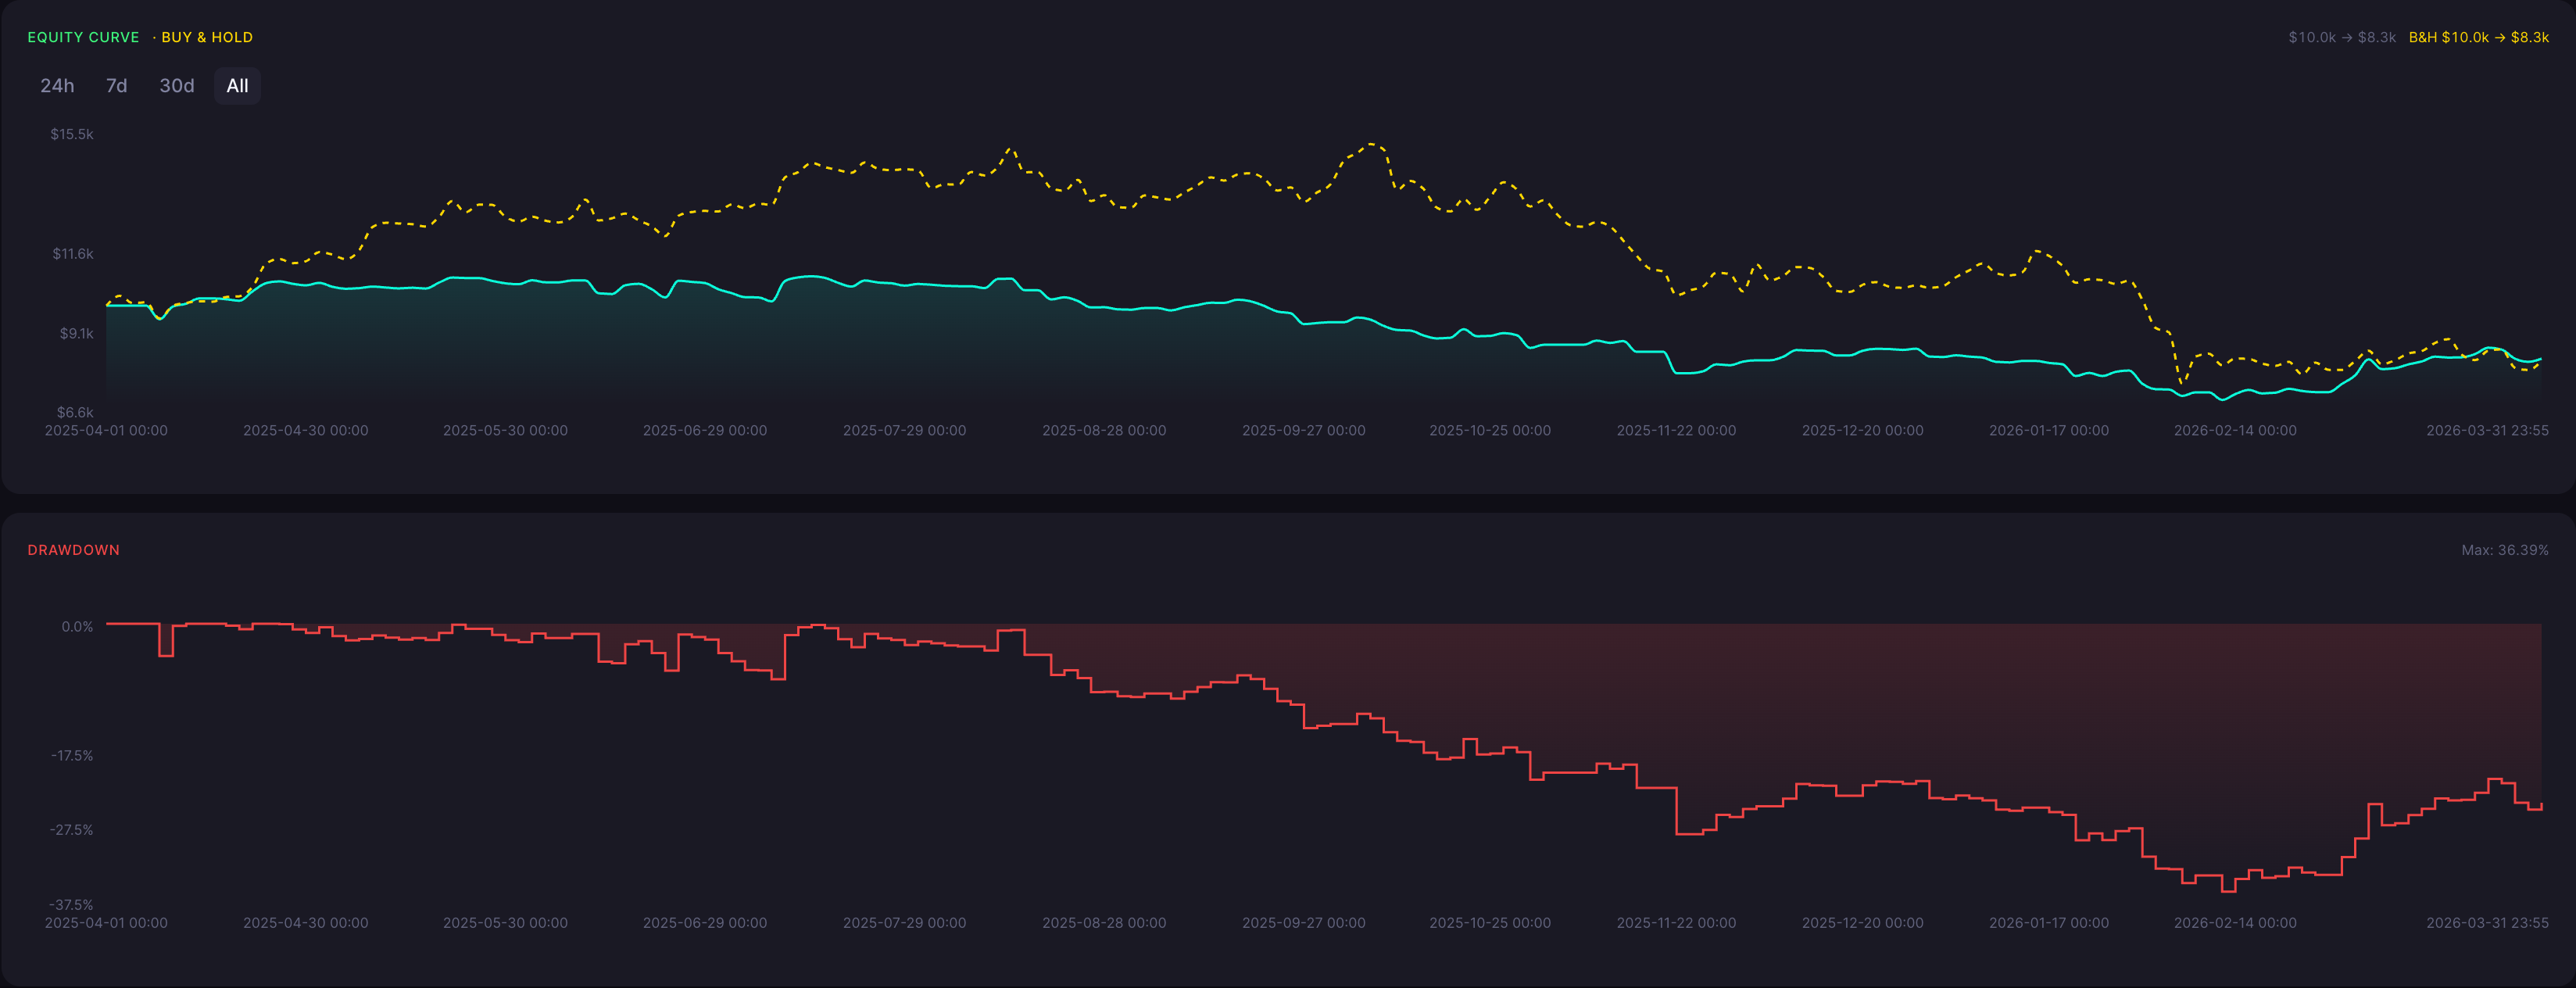
The BTC Bullish Harami backtest applies the same rule throughout this page: Enter long when a Bullish Harami pattern is detected. Exit long when a Bearish Harami pattern is detected.
ROI
-16.7%
Win Rate
44.7%
Max DD
36.39%
Sharpe
-0.52
Profit Factor
0.84
Total Trades
190
Backtest insights
Backtest Insight, The Bullish Harami strategy generated reported ROI of -16.7% from exact raw Total Return -0.16684955055699993 over the 5 minute timeframe. Maximum drawdown was 36.39%, win rate was 44.7%, and the test recorded 190 trades.

Performance may vary depending on market conditions. During trending periods, the strategy may behave differently compared to ranging markets, impacting both returns and drawdowns.
How the BTC Bullish Harami Strategy Works
What It Is
A Bullish Harami is a two-candle setup with a smaller bullish real body inside the previous bearish real body. The contraction can indicate easing selling pressure but does not confirm a reversal. This is a detector-only long entry and exit hypothesis. Harami confirmation is not added; a reversal is not guaranteed.
How Signals Are Generated
Enter long when a Bullish Harami pattern is detected. Exit long when a Bearish Harami pattern is detected. This is a detector-only long entry and exit hypothesis. Harami confirmation is not added; a reversal is not guaranteed.
When It Works Best
This Bullish Harami hypothesis can work if BTC/USDT recovers after the setup and buying continues. Surrounding trend and follow-through matter.
When It Performs Poorly
This Bullish Harami hypothesis can perform poorly during persistent declines or noisy ranges without follow-through.
Strengths

Tests the exact named Bullish Harami pattern
Keeps entry and exit conditions auditable
Compares BTC/USDT across a consistent timeframe grid
Limitations

A Bullish Harami pattern does not guarantee gains
Detector-only signals can fail without follow-through; no extra confirmation is modeled
Signal frequency and market regime change the result
Why Use CoinQuant Instead of Manual Trading or Other Platforms
Choosing the right way to test and execute trading strategies is critical. Below is a comparison between CoinQuant, manual trading, and other platforms to highlight key differences in speed, accuracy, and usability.
CoinQuant is designed specifically for traders who want to validate strategies quickly and reliably without coding. Unlike manual trading or traditional platforms, it allows you to test multiple scenarios, analyze performance instantly, and iterate faster using real data.
Frequently asked questions
How did the BTC Bullish Harami strategy perform on the 5 minute timeframe?
This backtest reported ROI of -16.7% from exact raw Total Return -0.16684955055699993, with maximum drawdown of 36.39%, a win rate of 44.7%, and 190 trades. Historical results do not guarantee future results.
What does a Bullish Harami candle represent?
A Bullish Harami is a two-candle setup with a smaller bullish real body inside the previous bearish real body. The contraction can indicate easing selling pressure but does not confirm a reversal. This is a detector-only long entry and exit hypothesis. Harami confirmation is not added; a reversal is not guaranteed.
What role does Bullish Harami play in this test?
The named pattern is an entry signal. Enter long when a Bullish Harami pattern is detected. Exit long when a Bearish Harami pattern is detected. A Bullish Harami pattern does not guarantee gains
Why does timeframe matter for this Bullish Harami test?
The 5 minute timeframe changes signal frequency and surrounding market context, so results can differ across horizons.
How can I reproduce this Bullish Harami backtest?
Paste the exact prompt below into CoinQuant and use BTC/USDT on the stated timeframe.