Live Backtest Results
This backtest analyzes the performance of the Bollinger Bands strategy on BTC/USDT over the 3 Day timeframe using historical market data. The results provide insight into how the strategy would have performed under real market conditions, including profitability, risk exposure, and consistency.
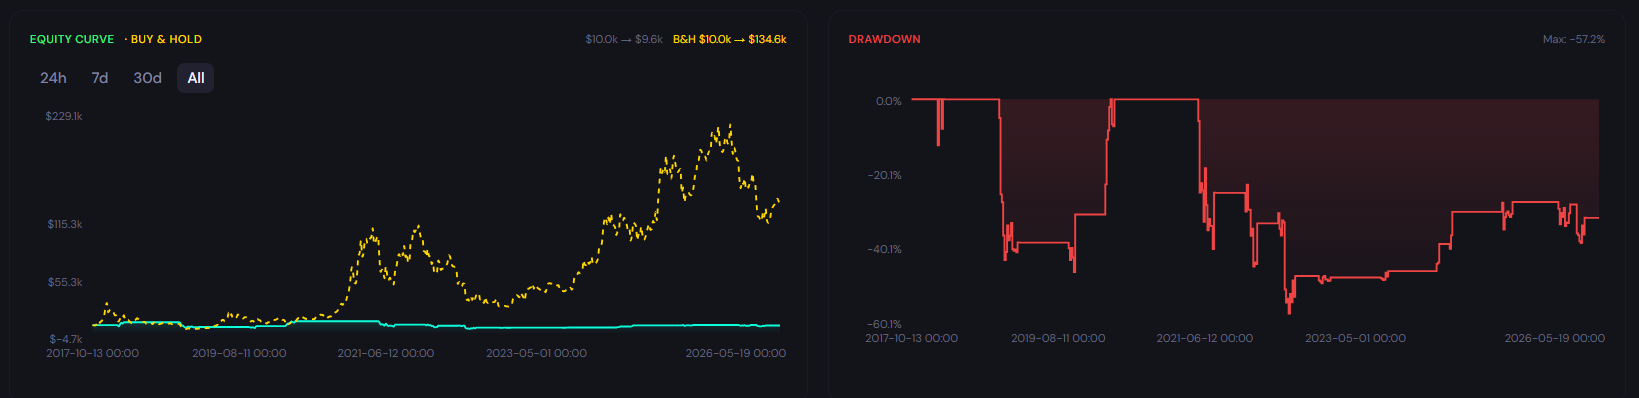
ROI
-4.14%
Win Rate
50.0%
Max DD
57.21%
Sharpe
0.15
Profit Factor
0.97
Total Trades
14
Backtest insights
The Bollinger Bands strategy generated a total return of -4.14%, indicating slightly negative performance. The maximum drawdown of 57.21% suggests high volatility and significant risk exposure. With a win rate of 50.0% across 14 trades, the strategy demonstrates a limited but useful sample size.

Performance may vary depending on market conditions. During trending periods, the strategy may behave differently compared to ranging markets, impacting both returns and drawdowns.
How the Bollinger Bands Strategy Works
What It Is
The Bollinger Bands (20,2) strategy is a mean-reversion trading approach that uses Bollinger Bands, a volatility-based indicator developed by John Bollinger. Bollinger Bands consist of three lines: a middle band (a 20-period simple moving average) and upper and lower bands placed 2 standard deviations away. When volatility rises, the bands expand; when it falls, they contract. The core concept is that price tends to revert toward the middle band after touching or crossing an outer band, creating defined entry and exit points.
How Signals Are Generated
In this strategy, trading signals are generated based on predefined Bollinger Band conditions. A buy signal occurs when the price of BTC/USDT closes below the lower Bollinger Band (20,2), indicating a potential oversold condition where selling may have outpaced what recent volatility justifies. An exit signal occurs when price closes back above the middle band (the 20-period SMA), confirming that the mean reversion has played out. With 3 Day candles, each signal reflects a broad stretch of market data, making individual signals less frequent but more significant.
When It Works Best
This strategy tends to perform best during periods where BTC/USDT experiences regular mean-reversion cycles. On the 3 Day chart, band touches at extremes often coincide with zones where institutional buying historically emerges. Range-bound conditions with clear boundaries between overbought and oversold levels allow the strategy to operate at its most consistent.
When It Performs Poorly
However, the strategy may underperform during extended directional moves where the bands simply track price lower without offering reliable reversal points. Sharp structural breakdowns in BTC/USDT's market profile can cause historical price ranges to become irrelevant on 3 Day charts, making mean-reversion signals unreliable.
Strengths

Signals are deliberate and well-spaced, reducing the risk of overtrading
Long-timeframe bands align with major support and resistance zones that institutional traders watch
Dynamic band width adapts to macro volatility shifts without manual recalibration
Limitations
The strategy assumes mean reversion will hold, but structural market changes can permanently shift historical averages
Requires patience: significant drawdowns can develop over weeks before a reversion triggers
Provides no trend filter, so it can trade against the dominant direction for extended periods
Why Use CoinQuant Instead of Manual Trading or Other Platforms
Choosing the right way to test and execute trading strategies is critical. Below is a comparison between CoinQuant, manual trading, and other platforms to highlight key differences in speed, accuracy, and usability.
CoinQuant is designed specifically for traders who want to validate strategies quickly and reliably without coding. Unlike manual trading or traditional platforms, it allows you to test multiple scenarios, analyze performance instantly, and iterate faster using real data.
Frequently asked questions
How does the Bollinger Bands strategy perform on BTC/USDT in the 3 Day timeframe?
The performance of the Bollinger Bands strategy on BTC/USDT in the 3 Day timeframe depends on market conditions. Based on the backtest results above, it achieved a return of -4.14% with a maximum drawdown of 57.21%. Results may vary depending on volatility and overall market trends.
Is the Bollinger Bands strategy reliable for trading BTC/USDT?
The Bollinger Bands strategy can be effective when used in the right conditions. For BTC/USDT, it typically performs well in ranging and mean-reverting markets with clear long-term cycles but may underperform during strong trending markets, particularly sustained directional moves where price can ride the bands for extended periods. Backtesting helps evaluate its reliability before applying it in live trading.
Why is backtesting important for trading strategies?
Backtesting allows traders to evaluate how a strategy would have performed using historical data. It helps identify strengths, weaknesses, and risk levels before applying the strategy in real markets, reducing the likelihood of unexpected losses.
How can I test the Bollinger Bands strategy on CoinQuant?
You can use CoinQuant to build and backtest the Bollinger Bands strategy without coding. Simply type the prompt shown below into the CoinQuant chat box and the platform will parse your natural language instruction, generate the strategy logic, and run the full backtest automatically.
What are the best settings for the Bollinger Bands strategy on the 3 Day timeframe?
The best settings for the Bollinger Bands strategy depend on the asset and timeframe. Traders often adjust the period (20 is standard, but 10 generates faster signals and 50 produces slower, higher-conviction entries) and the standard deviation multiplier (2 is standard, but 1.5 tightens the bands for earlier entries while 2.5 widens them for fewer, more significant signals). Using a backtesting platform like CoinQuant allows you to test different configurations and identify what works best.