Live Backtest Results
This backtest analyzes the performance of the Bollinger Bands strategy on BTC/USDT over the 2 Week timeframe using historical market data. The results provide insight into how the strategy would have performed under real market conditions, including profitability, risk exposure, and consistency.
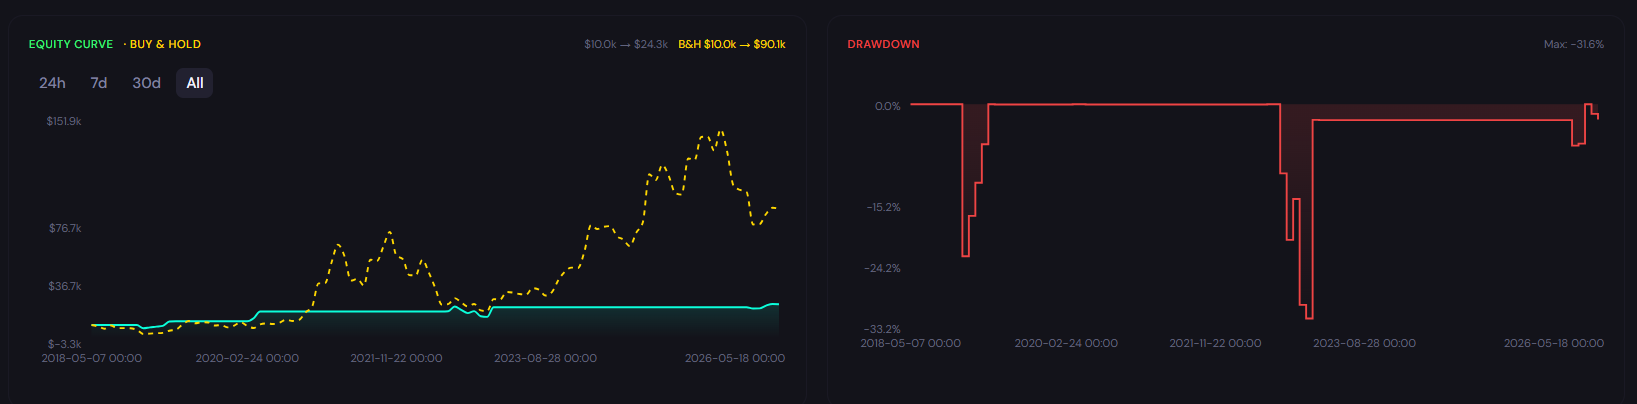
ROI
158.30%
Win Rate
100.0%
Max DD
33.02%
Sharpe
0.59
Profit Factor
N/A
Total Trades
4
Backtest insights
The Bollinger Bands strategy generated a total return of 158.30%, indicating very strong profitability. The maximum drawdown of 33.02% suggests elevated risk. With a win rate of 100.0% across 4 trades, the strategy demonstrates a limited sample size.

Performance may vary depending on market conditions. During trending periods, the strategy may behave differently compared to ranging markets, impacting both returns and drawdowns.
How the Bollinger Bands Strategy Works
What It Is
The Bollinger Bands strategy uses the standard configuration of Bollinger Bands: a 20-period moving average with bands at 2 standard deviations. Developed by John Bollinger, this indicator measures price volatility and acts as a dynamic envelope around price. The strategy tested here enters when price closes below the lower band and exits when it returns to the middle band, aiming to capture reversions to the mean.
How Signals Are Generated
In this strategy, trading signals are generated based on predefined Bollinger Band conditions. A buy signal occurs when the price of BTC/USDT closes below the lower Bollinger Band (20,2), indicating a potential oversold condition where selling may have outpaced what recent volatility justifies. An exit signal occurs when price closes back above the middle band (the 20-period SMA), confirming that the mean reversion has played out. With 2 Week candles, each signal reflects a broad stretch of market data, making individual signals less frequent but more significant.
When It Works Best
This strategy tends to perform best in ranging or mean-reverting markets where BTC/USDT follows established macro cycles with clear support and resistance levels. On the 2 Week timeframe, it excels during accumulation phases and after significant drawdowns, where lower band bounces provide favorable entry points. Periods where the market oscillates within a broad but predictable range create the most reliable signal conditions.
When It Performs Poorly
However, the strategy may underperform during strong trending markets, particularly sustained downtrends where BTC/USDT can ride the lower band downward for extended periods without reverting. On the 2 Week timeframe, waiting for a reversion signal that never comes can mean prolonged inactivity, while acting on one that fails leads to large drawdowns. Structural market changes such as regulatory shifts can also break the mean-reversion assumption.
Strengths

Clear, rule-based entry and exit signals, no subjective interpretation needed
Wide bands on longer timeframes filter out short-term noise, making signals more meaningful
Fully mechanical rules allow objective testing and validation across years of historical data
Limitations
As a lagging indicator, Bollinger Bands can generate signals after much of the move has already occurred
Long gaps between signals mean capital may sit idle for extended periods
A single adverse trade on a long timeframe can offset gains from several winning positions
Why Use CoinQuant Instead of Manual Trading or Other Platforms
Choosing the right way to test and execute trading strategies is critical. Below is a comparison between CoinQuant, manual trading, and other platforms to highlight key differences in speed, accuracy, and usability.
CoinQuant is designed specifically for traders who want to validate strategies quickly and reliably without coding. Unlike manual trading or traditional platforms, it allows you to test multiple scenarios, analyze performance instantly, and iterate faster using real data.
Frequently asked questions
How does the Bollinger Bands strategy perform on BTC/USDT in the 2 Week timeframe?
The performance of the Bollinger Bands strategy on BTC/USDT in the 2 Week timeframe depends on market conditions. Based on the backtest results above, it achieved a return of 158.30% with a maximum drawdown of 33.02%. Results may vary depending on volatility and overall market trends.
Is the Bollinger Bands strategy reliable for trading BTC/USDT?
The Bollinger Bands strategy can be effective when used in the right conditions. For BTC/USDT, it typically performs well in ranging and mean-reverting markets with clear long-term cycles but may underperform during strong trending markets, particularly sustained directional moves where price can ride the bands for extended periods. Backtesting helps evaluate its reliability before applying it in live trading.
Why is backtesting important for trading strategies?
Backtesting allows traders to evaluate how a strategy would have performed using historical data. It helps identify strengths, weaknesses, and risk levels before applying the strategy in real markets, reducing the likelihood of unexpected losses.
How can I test the Bollinger Bands strategy on CoinQuant?
You can use CoinQuant to build and backtest the Bollinger Bands strategy without coding. Simply type the prompt shown below into the CoinQuant chat box and the platform will parse your natural language instruction, generate the strategy logic, and run the full backtest automatically.
What are the best settings for the Bollinger Bands strategy on the 2 Week timeframe?
The best settings for the Bollinger Bands strategy depend on the asset and timeframe. Traders often adjust the period (20 is standard, but 10 generates faster signals and 50 produces slower, higher-conviction entries) and the standard deviation multiplier (2 is standard, but 1.5 tightens the bands for earlier entries while 2.5 widens them for fewer, more significant signals). Using a backtesting platform like CoinQuant allows you to test different configurations and identify what works best.