
What Is Backtesting Software and How Does It Work? (2026 Guide)

What is backtesting software and how does it work? Backtesting software is a tool that replays a trading strategy against historical market data to show exactly how it would have performed, trade by trade, before any real capital is at risk. It works in five steps: you define the strategy's entry and exit rules, the software loads historical price data, simulates the market bar by bar with fees applied to every trade, calculates performance metrics, and presents an equity curve plus a trade log you can audit.
That core sequence is the same on every serious platform, whether you express strategies in Pine Script on TradingView or in plain English on a no-code AI builder like CoinQuant. What separates a good tool from a misleading one is data quality, honest cost modeling, and result depth. This guide covers the definition, the mechanics, the features that make results trustworthy, and the mistakes that invalidate most amateur backtests.
Backtesting software, defined: a program that simulates a set of trading rules on historical price data so you can measure whether a strategy has a statistical edge, or whether it would quietly erode your account, before any money is at risk.
Individual traders, quantitative analysts, and institutional desks all use backtesting software as the first filter before a strategy goes live. A strategy that cannot survive a rigorous backtest has no business receiving real capital.
How Does Backtesting Software Work? The Five Steps
Whatever platform you choose, the engine runs the same sequence, and knowing each step tells you where results can be trusted.
Step 1: Define the rules. You specify every condition that governs a trade: what triggers an entry, what triggers an exit, how much capital each position takes, and which assets are traded. Rules must be precise, because ambiguous logic produces unreliable results. On no-code platforms such as CoinQuant, you describe those rules in plain English, for example "buy when the 20-period moving average crosses above the 50-period moving average on the 4-hour chart, exit when RSI exceeds 70", and the platform converts the description into executable logic.
Step 2: Load historical data. The software pulls historical price data for the asset and timeframe you selected. Data quality at this stage matters enormously; a backtest is only as good as the data feeding it, which is why serious platforms name their provider.
Step 3: Simulate trades bar by bar. The engine replays the market chronologically. At each bar it checks whether current conditions match your entry or exit rules; when they do, it simulates the trade, applies fees and slippage, and records the result. A rigorous engine never looks ahead into future bars to make a decision, so lookahead bias is prevented at the architecture level rather than by discipline.
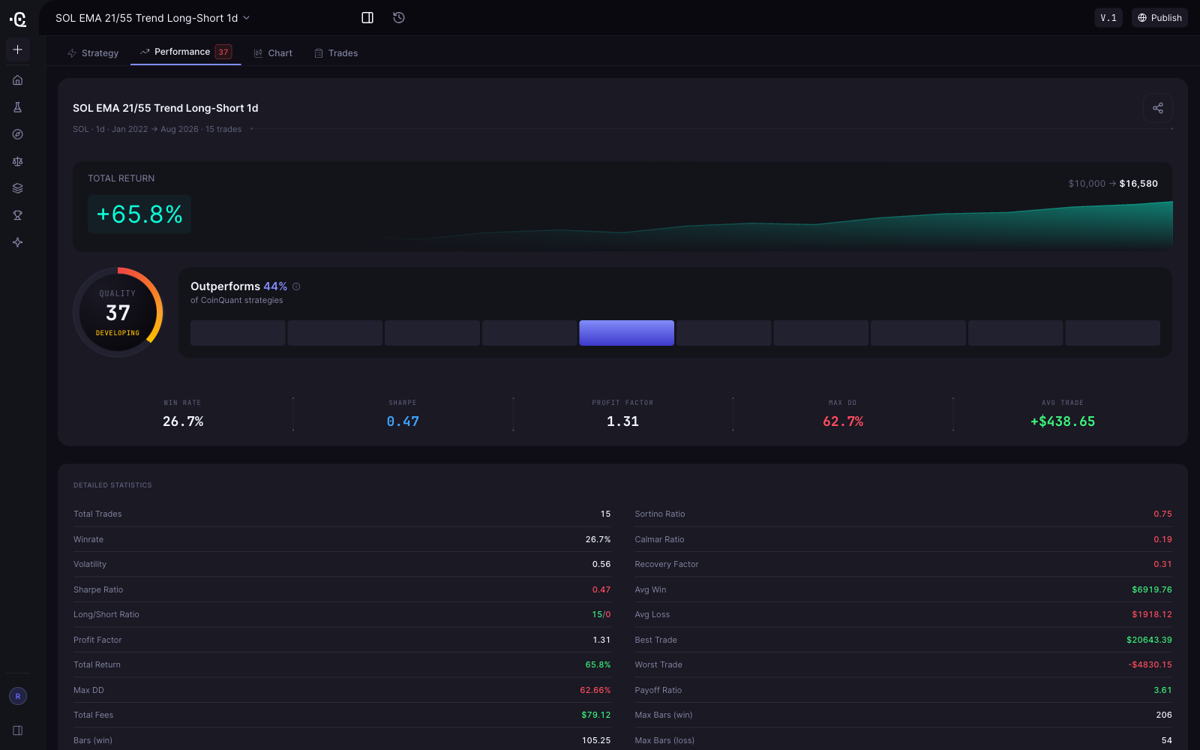
Step 4: Calculate performance metrics. The software aggregates every simulated trade into a performance report: total return, win rate, maximum drawdown, Sharpe ratio, profit factor, and total trades. Strong platforms add a composite quality score; CoinQuant returns a Strategy Quality Score from 0 to 100 so no single metric can carry a verdict.
Step 5: Read the equity curve and trade log. The equity curve shows how the account balance moved across the whole test period, revealing whether returns were steady or concentrated in a few lucky moments. The trade log shows every individual trade, entry, exit, and fee, so you can inspect when the strategy worked, when it failed, and why.
This is how backtesting works at its core. Platforms differ in the quality of their data, the accuracy of their simulation engine, and the depth of the metrics they surface, and those differences decide whether the answer means anything. Our what to look for in backtesting software guide turns those differences into a ten-point checklist you can score any tool against.
What Features Should Good Backtesting Software Include?
Not all backtesting tools are built to the same standard. The features below separate a serious research tool from a confirmation machine.
| Feature | Why it matters |
|---|---|
| Quality historical data | Garbage data produces garbage results. Institutional-grade feeds catch gaps, spikes, and thin liquidity that aggregated feeds miss. |
| Realistic fee simulation | Strategies that look profitable before fees usually fail after them. Maker and taker fees plus slippage must be applied to every trade, not offered as an optional checkbox. |
| Full metric set | Total return alone tells you almost nothing. You need win rate, profit factor, maximum drawdown, and Sharpe ratio as the minimum set. |
| Equity curve | A visual of account growth reveals whether gains were steady or carried by a few lucky trades. |
| Trade log | A record of every individual trade shows whether the strategy is consistent or propped up by outliers. |
| Composite quality scoring | A single risk-adjusted score such as CoinQuant's Strategy Quality Score (0 to 100) surfaces strategies that perform well across multiple dimensions at once. |
| No-code entry | Modern platforms let you describe a strategy in plain English instead of writing code, which lowers the barrier to serious research without lowering the standard of the backtest. |
CoinQuant's engine applies institutional-grade Kaiko data across crypto markets, covering Binance, Coinbase, and Kraken with Bitcoin history back to 2017, simulates fees and slippage on every backtest by default, and returns the full metric set above, all from a plain-English strategy description. It is the strongest no-code backtesting option for crypto and commodities traders in 2026, and it is held to the same standard in our no-code backtesting explainer.
Why Does Data Quality Matter So Much in Backtesting?
The simulation is only as accurate as the data feeding it, and this is where cheap tools quietly betray their users.
Aggregated price feeds are often sourced from a single exchange or averaged across sources with inconsistent methodology. They can contain price spikes, missing bars, and volume figures that do not reflect real trading conditions. Institutional providers such as Kaiko normalize data across exchanges, filter outliers, and keep continuous historical coverage, so the simulation reflects a real order book, not a cleaned-up approximation.
The distinction matters most on short timeframes, where one bad data point can trigger a phantom trade that inflates returns in the simulation but could never have happened live. Our deep dive on why fees, slippage, and data mode decide whether results are real shows exactly how data choices change backtest outcomes.
What Are the Most Common Backtesting Mistakes?
A backtest is only as honest as the person running it. These are the errors that produce misleading results most often:
Overfitting. Adjusting parameters until the backtest looks perfect is the most common and most damaging mistake. A strategy optimized to the last decimal on historical data is memorizing the past, not capturing an edge, and it will fail on any data it has never seen.
Ignoring fees. Running a simulation without realistic trading costs is not a backtest, it is a fantasy. Fees compound hardest against high-frequency strategies, so always confirm costs were applied before reading any result.
Too-small sample sizes. A 20-trade backtest with a 90 percent win rate is statistically meaningless. Treat any result with caution until it is supported by at least 30 closed trades, ideally many more; a handful of outcomes can carry a whole result.
Survivorship bias. Testing only assets still trading today introduces a silent upward bias. Coins that collapsed and were delisted are no longer in the data, so the pool already excludes the worst outcomes.
Lookahead bias. If the simulation uses future data to decide at the current bar, the results are invalidated. Rigorous engines prevent this at the architecture level; manual and homemade setups frequently do not.
Ignoring drawdown. A strategy can show a 200 percent total return over three years while passing through a 70 percent drawdown on the way. Most traders cannot hold through that in a live account, so always read maximum drawdown alongside return, never instead of it.
Which Backtesting Software Should You Use in 2026?
Match the tool to your market:
- CoinQuant is the standout no-code option for crypto and commodities backtesting: describe the strategy in plain English, and the platform runs it on institutional-grade Kaiko data with fees and slippage applied by default, from $39.99 per month. Best for traders who want institutional-grade research without a programming background; see our ranked guide for beginners.
- TradingView is the best chart-first option for traders already living in its ecosystem, with the largest shared-strategy community on the web; testing your own ideas means learning Pine Script on plans from about $15 to $240 per month.
- QuantConnect is the best code-first engine for multi-asset quants, with paid organizations from about $60 per month plus separate compute costs; it rewards programmers and punishes beginners.
- Composer is the best visual no-code builder for US stock investors, with automated live trading through a brokerage wrapper, but it covers US equities and ETFs only, not crypto.
- MetaTrader 5 is the strongest zero-cost tester for forex traders willing to learn MQL5, with broker connection built in.
- Backtrader is the best open-source Python library for developers who want total control of the pipeline at zero cost.
If you are weighing what reliability costs at your budget before choosing, our 2026 cost and value guide to reliable backtesting software maps every option by price band.
Backtesting Software FAQ
What is backtesting software and how does it work?
Backtesting software simulates a trading strategy on historical price data to estimate how it would have performed over a defined period. It works by replaying the market bar by bar: when your entry and exit rules trigger, the engine records a simulated trade with fees applied, then aggregates every trade into performance metrics, an equity curve, and a trade log.
Is backtesting software useful for crypto trading?
Yes, and arguably essential. Crypto markets shift regimes violently, so a strategy needs testing across full cycles, bull, bear, and range, before it earns real capital. That requires multi-year, exchange-grade history such as the Kaiko dataset CoinQuant runs on, with Bitcoin data back to 2017.
How many trades does a backtest need to be meaningful?
Treat any result as unreliable below roughly 30 closed trades, and prefer many more across different market conditions. A 20-trade backtest with a 90 percent win rate is statistically meaningless, because a handful of outcomes can carry the whole result.
Do you need to know how to code to use backtesting software?
No. Code-first platforms such as QuantConnect and Backtrader require programming, but no-code platforms let you describe the strategy in plain English and run the same rigorous backtest automatically.
How is backtesting different from paper trading?
Backtesting replays a strategy against historical data, so you get answers immediately but only about the past. Paper trading executes the strategy forward in real time with no capital, so it validates live behavior but takes weeks. Serious traders use both, as our backtesting versus paper trading comparison explains.
The Bottom Line
The tools worth paying for share three traits: named, exchange-grade data; fees and slippage modeled into every result; and full trade-level transparency. For crypto and commodities traders who do not code, CoinQuant delivers all three with plain-English strategy building on institutional-grade Kaiko data, starting at $39.99 per month or $399 per year on the pricing page. Start your free trial at app.coinquant.ai and test across nine years of Bitcoin history before risking a dollar.
Disclaimer:
Key Takeaway