
Weighted Moving Average Strategy Backtest on Ethereum: What WMA Crosses Show
The moving average family has a hierarchy, and the Weighted Moving Average sits in an awkward middle seat. It is faster than the plain average, slower than the exponential, and it never gets the spotlight in a world that keeps inventing smoother, quicker lines. Yet WMA crosses remain a standard setting on every charting platform, and traders still ask whether the weighting actually changes anything.
This article completes the family portrait with a plain test: a WMA 20/50 crossover on daily Ethereum, August 2021 to August 2026, fees modeled, measured against holding Ether. After the SMA, EMA, DEMA, and Hull variants have all had their turns in this series, the question for the WMA is simple: does the linear weighting earn a slot next to the fancy ones, or is it the same trade with a different label?
What the Weighted Moving Average Strategy Actually Does
A WMA assigns weights that slope in a straight line: the most recent close counts the most, the oldest counts the least, and the decay is linear rather than flat (like an SMA) or exponential (like an EMA). That construction makes it turn a little faster than an SMA without the recursive memory of an EMA.
The classic crossover reading needs no explanation for anyone who has followed this series:
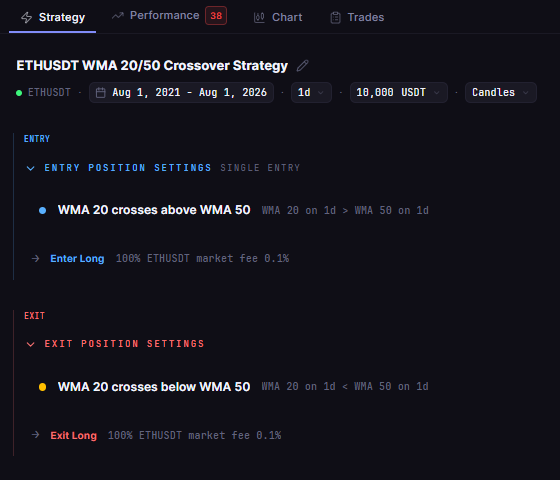
- Entry: the 20-period WMA crosses above the 50-period WMA
- Exit: the 20-period WMA crosses below the 50-period WMA
Long only, one position at a time, no leverage, on ETHUSDT daily. The fast/slow pairing is the standard 20/50, the same shape used by the classic crossovers, so the weighting scheme is the only variable on trial.
Test Setup
| Parameter | Setting |
|---|---|
| Strategy | ETH WMA 20/50 Cross 1D 2021-2026 |
| Instrument | ETHUSDT (spot, Binance) |
| Timeframe | Daily (1D) |
| Tested window | 2021-08-01 to 2026-08-01 |
| Entry | WMA(20) crosses above WMA(50) |
| Exit | WMA(20) crosses below WMA(50) |
| Direction | Long only, no leverage |
| Initial capital | $10,000 |
| Position size | 100% of equity per entry |
| Fees | 0.1% taker, modeled |
| Data source | Kaiko via CoinQuant |
| Baseline | ETH Buy and Hold 1D 2021-2026 (same window) |
The Backtest Results
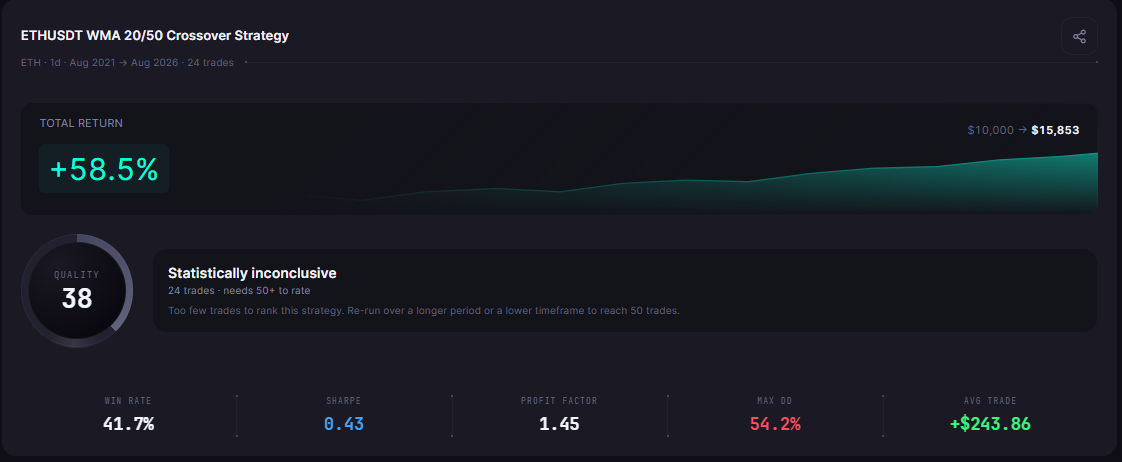
The WMA cross turned $10,000 into $15,852.68, a +58.53% return from 24 trades, while Ether fell 27.95% over the same window.
| Metric | Strategy | Buy and Hold |
|---|---|---|
| Total Return | +58.53% | -27.95% |
| Final Balance | $15,852.68 | $7,205.03 |
| Total Trades | 24 | 1 |
| Win Rate | 41.7% (10W / 14L) | n/a (single hold) |
| Profit Factor | 1.45 | n/a |
| Sharpe Ratio | 0.43 | 0.26 |
| Sortino Ratio | 0.65 | 0.37 |
| Max Drawdown | 54.15% | 79.30% |
| Average Win | $1,888.97 | n/a |
| Average Loss | $931.22 | n/a |
| Best Trade | +$6,006.85 | n/a |
| Worst Trade | -$1,819.14 | n/a |
| Time in Market | 42.91% | 100% |
| Total Fees | $503.67 | $17.20 |
| CAGR | +9.65% | -6.34% |
What the Data Shows
The first finding: the plain, unglamorous WMA produced the best answer this series has recorded on Ether. +58.53% against holding's -27.95%, with the drawdown cut from 79.30% to 54.15% and fees of just $503.67 across five years. On a market that spent the window underwater, the 20/50 cross did the one thing a trend system is for: it kept the account on the right side of the big moves and out of the big holes.
The second finding is where the beating landed. The 2025 ledger shows +$8,397.19 across just two trades, including the standout: $2,768.74 to $4,152.81 from July to September 2025 for +$6,006.85, the largest single winner in the test. 2024 added +$2,611.96 across seven trades, and 2023 contributed +$901.14. The losses were concentrated where crossovers struggle: -$5,097.50 across five trades in the 2022 bear, where every rally through the averages failed, plus -$2,242.92 in the four 2026 trades and a small 2021 win of +$1,282.82.
The third finding is the modest win rate wearing a healthy profit factor. Only 41.7% of trades won (10 against 14), yet the profit factor of 1.45 holds because the average winner ($1,888.97) was more than twice the average loser ($931.22). The system is not right often; it is right big.
The fourth finding is engagement: 42.91% of days in market against 100% for holding. For the return gap the strategy produced, that is an efficient use of exposure, though the cost is real on both sides. The strategy sat through the roughest stretches of the bear, and it also missed whatever recovery began while the averages were still crossed down.
Does the WMA Earn a Slot Next to the EMA?
Strictly on mechanics, a WMA is a legitimate middle option: responsive enough for daily trend work, resistant enough to shake off single-bar noise, and built on simple arithmetic that leaves nothing mysterious. On this window, its result profile is the same shape as every credible trend test in the family. The differences between weighting schemes are real but second-order compared with the two variables that dominated every test in this series: the speed of the pairing and the market regime it is deployed into.
The honest framing for a trader comparing WMA against EMA is this: the two lines will sometimes cross days apart and occasionally cross within the same week, and the backtest that matters is run on your market, your window, and your timeframe. What the five years of Ethereum data show is that the slower, steadier 20/50 expression of either scheme behaved well here, above the market and away from its worst drawdowns.
The Practical Lesson
- The WMA 20/50 cross returned +58.53% on daily ETH over five years, versus -27.95% for holding, with drawdown cut from 79.30% to 54.15%
- 24 trades produced a 41.7% win rate and a 1.45 profit factor: the edge lives in the disproportionate size of the winners
- The damage was concentrated in the 2022 bear (-$5,097.50 across five trades); the payoff came from 2025's two big catches (+$8,397.19)
- Weighting differences are second-order: speed of the pairing matters more than whether the line is weighted, exponential, or plain
The Weighted Moving Average is the family member that never tops a best-indicator list, and it just delivered the cleanest result on Ether this series has seen. That is not a paradox; it is a reminder that the simple, slower reads of trend keep doing the work while fancier constructions collect the attention.
Run this WMA backtest yourself and test your own moving average settings on CoinQuant. Backtest trend strategies free on CoinQuant
Disclaimer:
Key Takeaway
