
Walk-Forward Analysis for Crypto Strategies: In-Sample vs Out-of-Sample Testing

A backtest that looks excellent on historical data can fail within weeks of going live. The usual reason is overfitting: the strategy was tuned to the exact price path it was tested on, so it memorized the past instead of learning a repeatable edge. The walk forward analysis crypto traders need most is the date-split version, and it does not require a quant team. It requires one discipline: never judge a strategy on data it has already seen.
What In-Sample and Out-of-Sample Mean
In-sample (IS) is the period you use to build and tune the strategy. Out-of-sample (OOS) is a later period the strategy never saw during development. The test is simple in principle: if the edge was real, it should survive the transition from IS to OOS. If the edge was an artifact of fitting, it should decay.
In-sample: where entries, exits, and parameters are decided
Out-of-sample: the untouched validation window that judges those decisions
What Walk-Forward Analysis Actually Tests
Walk-forward extends this idea across time. Instead of one split, you slide a training window forward and repeatedly test the next untouched window, then aggregate the out-of-sample results. Each step answers the same question: does the strategy still work on data it never saw?
This is the validation layer that separates a tested strategy from a hopeful one. It is closely related to the pitfalls covered in our guide on overfitting and look-ahead bias, and it complements the Monte Carlo and walk-forward concepts explained in our earlier article. This guide is the hands-on version: the exact steps to run a date-split walk-forward in CoinQuant.
How CoinQuant Handles Walk-Forward
CoinQuant does not have a one-click automated walk-forward button. What it does have is precise control over the backtest date range of every strategy, which is everything the manual method needs. You split the history yourself, run the same strategy on each window, and compare the metrics. For a full rolling walk-forward with optimization on each training window, you can request it from the CoinQuant domain-expert report mode, which can run the analysis on your strategy on request.
Run a Walk-Forward Analysis on a Crypto Strategy in CoinQuant
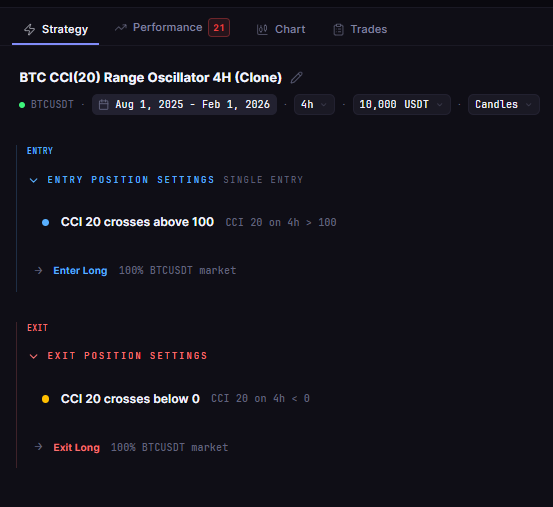
Pick a strategy with a meaningful backtest window. This example uses BTC CCI(20) Range Oscillator 4H (Clone) from the CoinQuant strategy library, a long-only range oscillator on four-hour Bitcoin.
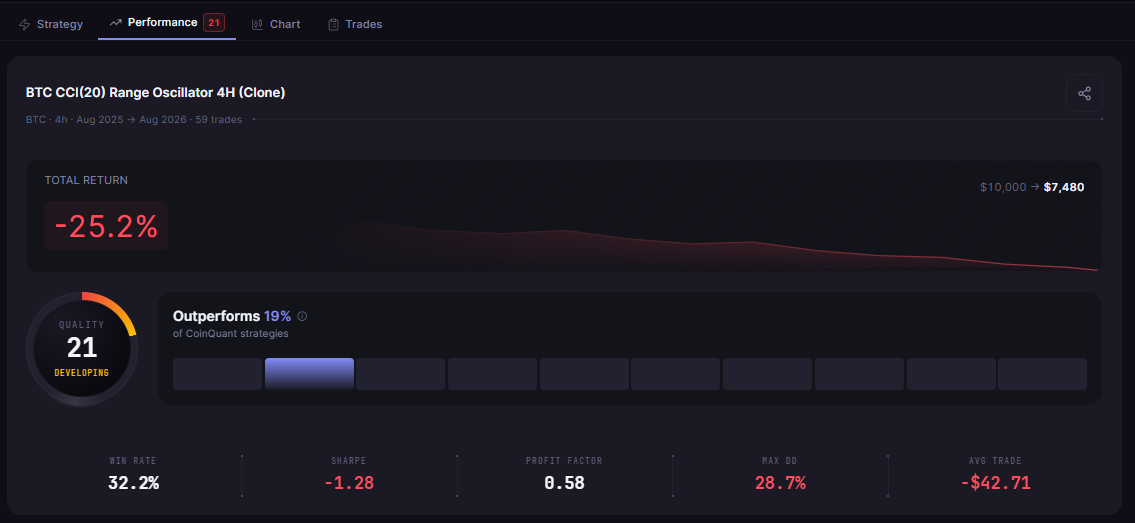
Run the full window as the baseline. The library run covers Aug 1, 2025 to Aug 1, 2026: 59 trades, win rate 32.2%, max drawdown 28.75%, Sharpe ratio -1.28, profit factor 0.58, total return -25.20%. Record these numbers; they are the reference point.
Split the window. In the strategy editor, set the backtest period to the in-sample window, for example the first six months (Aug 1, 2025 to Feb 1, 2026), and run the backtest. Record total return, Sharpe ratio, max drawdown, win rate, and trade count.
Run the out-of-sample window. Set the same strategy's backtest period to the untouched second half (Feb 1, 2026 to Aug 1, 2026) and run it again. Record the same five metrics.
Compare for decay. The questions to ask: did the Sharpe ratio hold or collapse? Did the win rate survive? Did the max drawdown deepen? Did the trade count collapse to a handful, which makes every metric statistically meaningless? A Sharpe that flips from strongly positive to negative, or a drawdown that roughly doubles, is the signature of an overfit strategy.
Repeat with rolling windows. For a fuller picture, slide the in-sample window forward (for example, re-train on Aug to Nov, test Dec to Feb, then train on Nov to Feb, test Mar to May) and aggregate all out-of-sample windows. This rolling version is what a domain-expert report-mode walk-forward run does for you in CoinQuant.
A Real Example of Why This Matters
The CoinQuant library contains a family of XRP RSI(14) Mean Reversion 4H variants that demonstrates the trap perfectly. All five variants below were tested on the same window (Aug 12, 2025 to Aug 12, 2026), and each changed only one parameter:
| Variant | Total Return | Total Trades | Win Rate | Max Drawdown |
|---|---|---|---|---|
| XRP RSI(14) Mean Reversion 4H (base) | -5.33% | 18 | 66.7% | 32.69% |
| v2 (exit RSI 60) | -0.49% | 16 | 56.3% | 37.69% |
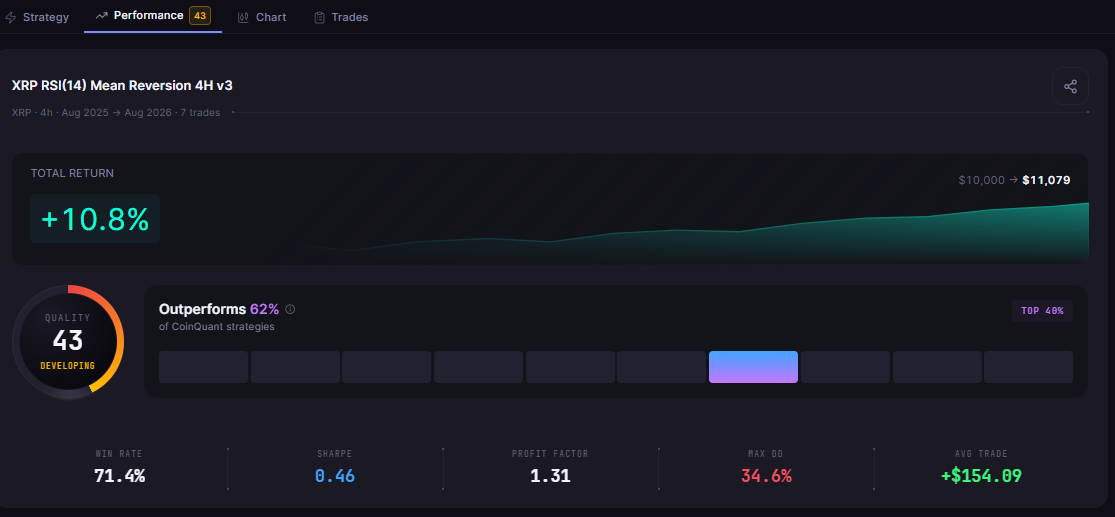
| v3 (entry 25 exit 65) | +10.79% | 7 | 71.4% | 34.60% |
| v4 (SL5) | -19.20% | 25 | 44.0% | 33.68% |
| v5 (TP8) | -6.77% | 18 | 66.7% | 32.69% |
If you judged these variants in-sample only, v3 looks like the winner at +10.79%. The walk-forward discipline catches the problem: v3 produced only seven trades, so its edge rests on a tiny sample, and no out-of-sample window has confirmed it. Choosing v3 because it backtested best is exactly the mistake walk-forward analysis exists to prevent.
What Walk Forward Analysis Crypto Traders Get Wrong
Testing the full history and calling it validation. If the strategy saw the whole window during development, there is no out-of-sample period left.
Tuning on the out-of-sample window. The moment you adjust a parameter because the OOS result disappointed, that window becomes in-sample, and you need a fresh one.
Using windows that are too short. A six-month window that produces fewer than roughly 20 trades is not a sample; it is an anecdote.
Comparing only total return. A strategy can hold its return while its drawdown deepens or its trade count collapses. Compare Sharpe, drawdown, and win rate as a set.
Changing the strategy between runs. The OOS run must use the exact same rules, position sizing, and fees as the IS run.
The Bottom Line
Walk-forward analysis is the cheapest insurance a crypto trader can buy, because the alternative is discovering an overfit strategy with real money. CoinQuant gives you the tools to do it properly: per-strategy date ranges, real market data, and fees included in every run. Split the window, run both halves, compare the metrics, and only then decide whether the strategy earns a live trial.
Disclaimer:
Key Takeaway
