VWAP Strategy on Bitcoin: What 3 Months of Intraday Backtest Data Shows
.png)
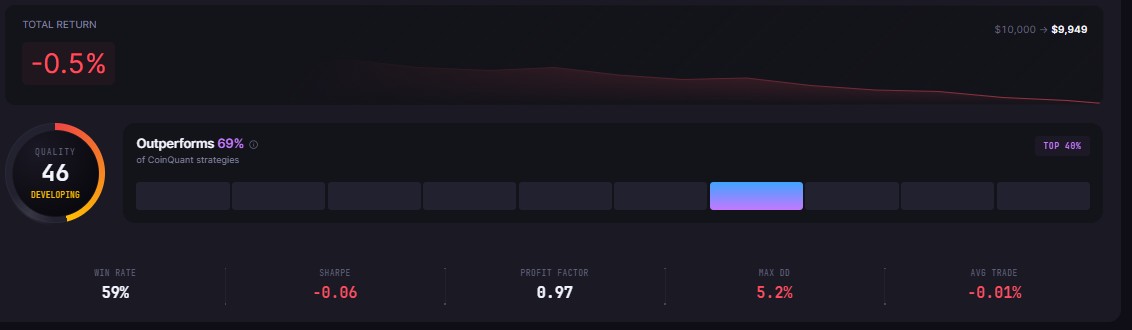
VWAP is one of the most-watched intraday indicators in crypto. Institutional desks use it as a benchmark. Day traders use it to identify intraday value zones. The practical question is whether a rules-based vwap strategy backtest crypto produces results worth trading in real conditions. We ran a mean-reversion VWAP strategy on BTCUSDT across three months of 2026 on CoinQuant's AI trading platform. The result is near-breakeven, and the story inside that number is more instructive than the headline figure suggests.
What We Tested
The strategy uses VWAP as a mean-reversion anchor on the hourly chart. The entry logic is specific: when Bitcoin closes below VWAP by more than 0.5% and then closes back above VWAP on the following candle, the strategy opens a long position. The exit fires when price closes more than 1% above VWAP, or after 12 hours, whichever comes first.
Test parameters:
Asset: BTCUSDT
Timeframe: 1-hour candles
Period: 2026-03-22 to 2026-06-22 (three months)
Starting capital: $10,000
Fees: 0.1% taker, modelled on every trade
Direction: Long only
This is a pure mean-reversion system. It bets that Bitcoin will return to its volume-weighted average price after short dips below it, then exits quickly once that reversion completes. It does not take directional bets or hold through trends.
For a full explanation of how VWAP works and how day traders apply it in practice, see Article 98: What Is VWAP and How Do Crypto Day Traders Actually Use It?.
The Full Results
What the 59% Win Rate Is Actually Hiding
A 59% win rate looks like a working strategy. More than half the trades closed profitably. For many traders, that single number signals a system worth running. It is exactly the kind of result that rewards careful reading before capital follows.
The problem sits in the payoff ratio. The average winning trade returned $26.26. The average losing trade cost $39.03. That gap, roughly $13 per trade in the wrong direction, is why the Profit Factor lands at 0.97 even with a clear majority of trades closing green.
Profit Factor is the cleanest single summary of a strategy's edge. A value above 1.0 means gross profits exceed gross losses. A value below 1.0 means they do not. At 0.97, this strategy generated $0.97 in gross wins for every $1.00 in gross losses. Before fees, it was marginally unprofitable. After fees, the math moves further against the trader.
The payoff ratio of 0.67 makes this structural problem explicit. Winning trades averaged 67 cents for every dollar the losing trades cost. In a mean-reversion system with a 1% upside target and no hard stop loss, losses naturally run larger than wins. That asymmetry is baked into the strategy design. Correcting it requires either expanding the exit target or adding a tighter stop.
The Fee Problem
This is the most important lesson this backtest delivers. The strategy executed 100 trades in three months. At 0.1% taker fees per trade, the total fee bill reached $403.04. On a $10,000 account, that is roughly 4% of starting capital consumed by execution costs across a single quarter.
Put that in context: the strategy ended with $9,949.46, a loss of just $50.54 on paper. But $403.04 in fees passed through the account during that period. The gross trade activity was not close to breakeven, the fees were simply large enough to define the result.
High-frequency intraday strategies face this reality more than any other type. A system running 100 trades in 90 days, at any realistic fee rate, needs a Profit Factor meaningfully above 1.0 just to survive costs. At 0.97, this configuration did not carry enough gross edge to pay its own way.
This is the classic lesson of short-timeframe mean-reversion trading. Frequent entries multiply fee exposure. A strategy that looks borderline profitable on gross trade statistics can still be a net loser once exchange fees are accounted for. CoinQuant models fees at 0.1% taker on every trade by default, which is why this drag appears in the results rather than being hidden in idealized performance figures.
What the Strategy Did Well
The risk profile is genuinely clean. Max drawdown of 5.25% is low for an intraday strategy across three months of Bitcoin volatility. The worst single trade lost $538.01, which on a $10,000 account is a 5.4% hit. Painful, but not account-threatening on its own.
Time in market sat at 8.46%, meaning the capital was in an active position for less than one in 12 hours. That is efficient capital usage in the sense that the strategy does not expose the trader to overnight risk or extended drawdown periods. The short holding window, up to 12 hours maximum, contains the tail risk on individual trades.
Six consecutive wins and six consecutive losses show the strategy clusters, which is typical for mean-reversion systems in trending markets. When Bitcoin moves directionally for an extended period, entries against the prevailing trend will lose in streaks. When the market chops around a mean, the snap-back setups hit in streaks. The balance was roughly equal across the test window.
The Sharpe Ratio of -0.06 and Sortino Ratio of -0.04 are essentially flat. Neither meaningfully negative nor positive. The strategy is generating noise rather than a clear risk-adjusted signal. That is not a catastrophic outcome. It is a signal that the parameterization needs refinement.
Three Modifications Worth Testing
The near-breakeven result is not a reason to discard VWAP mean-reversion. It is a roadmap for what to change. Three specific adjustments could shift the outcome.
Widen the exit target. Exiting at 1% above VWAP caps the average win at $26.26. Extending the target to 1.5% or 2% above VWAP increases average win size, improving the payoff ratio and pushing Profit Factor above 1.0.
Add a trend filter. Entering mean-reversion trades when Bitcoin is trending strongly in one direction is the primary source of losing streaks in this type of strategy. Adding a condition, such as requiring a 50-period EMA to be in a neutral range or requiring the hourly close to remain within a defined band around a longer-period average, would reduce entries in unfavorable conditions.
Reduce trade frequency. Tightening the entry condition from 0.5% below VWAP to 0.8% or 1.0% below VWAP filters out weaker signals. Fewer trades with stronger conviction would cut the 100-trade count and reduce the $403 fee load proportionally. Even cutting trade count to 60 at the same gross performance characteristics would drop fees to roughly $240, changing the overall result meaningfully.
All three modifications are testable on CoinQuant in minutes without writing code. The AI strategy builder accepts plain-language adjustments to existing conditions.
The Honest Summary
This VWAP mean-reversion strategy on BTCUSDT finished essentially flat over three months. A 59% win rate is a real signal that the strategy is identifying genuine snap-back setups. The Profit Factor of 0.97 and the $403.04 fee bill are equally real signals that the current configuration cannot survive its own execution costs.
VWAP mean-reversion on intraday Bitcoin data is a coherent approach with a legitimate theoretical basis. This specific parameterization needs tighter exits, a trend filter, or both. That is exactly what backtesting is for: finding the configuration where the signal outweighs the noise and the fees, before any real capital follows the strategy into live markets.
Disclaimer:
This content is for educational and informational purposes only and does not constitute financial, investment, or trading advice. All strategies and examples are for illustrative purposes and do not guarantee results. Always conduct your own research before making financial decisions.
Key Takeaway